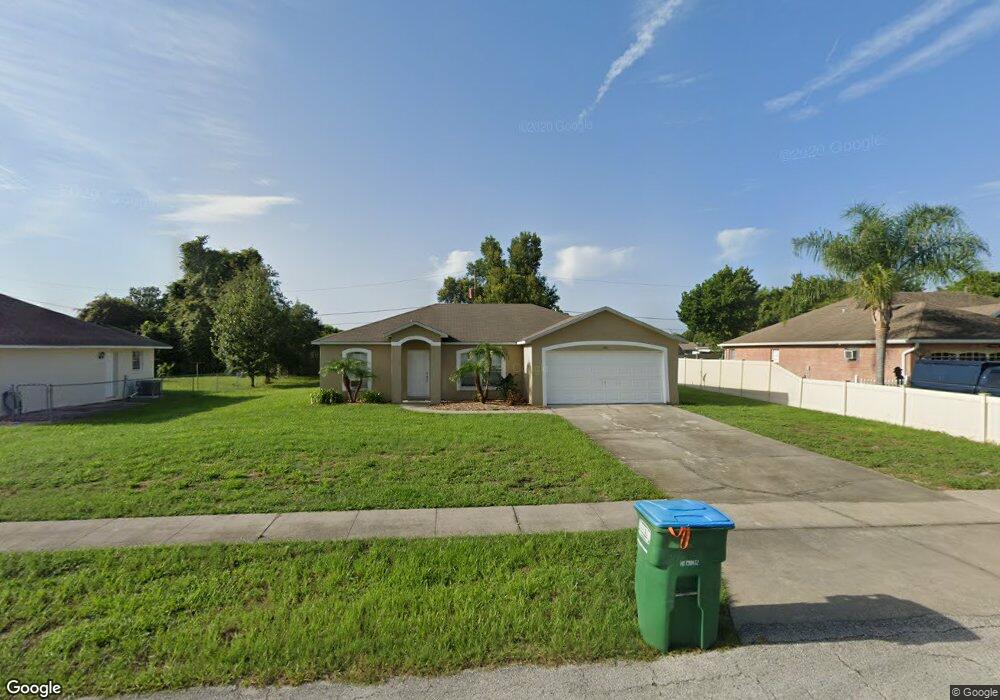
1061 Pinder St Deltona, FL 32725
Estimated Value: $270,000 - $302,000
3
Beds
2
Baths
1,926
Sq Ft
$148/Sq Ft
Est. Value
About This Home
This home is located at 1061 Pinder St, Deltona, FL 32725 and is currently estimated at $285,337, approximately $148 per square foot. 1061 Pinder St is a home located in Volusia County with nearby schools including Discovery Elementary School, Forest Lake Elementary School, and Deltona Middle School.
Ownership History
Date
Name
Owned For
Owner Type
Purchase Details
Closed on
May 12, 2021
Sold by
Home Sfr Borrower Llc
Bought by
Midway Exchange Borrower 5 Llc
Current Estimated Value
Purchase Details
Closed on
Sep 26, 2016
Sold by
Home Sfr Borrower Llc
Bought by
Home Sfr Borrower Llc
Purchase Details
Closed on
Feb 10, 2014
Sold by
Taft Haley M
Bought by
Rpa4 Llc
Purchase Details
Closed on
Nov 12, 2002
Sold by
Formoso Family Ltd Ptnr
Bought by
Taft Haley M
Home Financials for this Owner
Home Financials are based on the most recent Mortgage that was taken out on this home.
Original Mortgage
$588,396
Interest Rate
5.98%
Purchase Details
Closed on
Oct 29, 2002
Sold by
James Herman
Bought by
Formoso Family Ltd Ptnr
Home Financials for this Owner
Home Financials are based on the most recent Mortgage that was taken out on this home.
Original Mortgage
$588,396
Interest Rate
5.98%
Purchase Details
Closed on
Dec 15, 1987
Bought by
Rpa4 Llc
Purchase Details
Closed on
Sep 15, 1975
Bought by
Rpa4 Llc
Create a Home Valuation Report for This Property
The Home Valuation Report is an in-depth analysis detailing your home's value as well as a comparison with similar homes in the area
Home Values in the Area
Average Home Value in this Area
Purchase History
| Date | Buyer | Sale Price | Title Company |
|---|---|---|---|
| Midway Exchange Borrower 5 Llc | $100 | Rosenberg Lpa | |
| Home Sfr Borrower Llc | -- | None Available | |
| Rpa4 Llc | $87,900 | First American Title Ins Co | |
| Taft Haley M | $15,000 | -- | |
| Formoso Family Ltd Ptnr | $28,000 | -- | |
| Rpa4 Llc | $19,000 | -- | |
| Rpa4 Llc | $1,200 | -- |
Source: Public Records
Mortgage History
| Date | Status | Borrower | Loan Amount |
|---|---|---|---|
| Previous Owner | Taft Haley M | $588,396 |
Source: Public Records
Tax History Compared to Growth
Tax History
| Year | Tax Paid | Tax Assessment Tax Assessment Total Assessment is a certain percentage of the fair market value that is determined by local assessors to be the total taxable value of land and additions on the property. | Land | Improvement |
|---|---|---|---|---|
| 2025 | $4,896 | $256,057 | $54,539 | $201,518 |
| 2024 | $4,896 | $254,176 | $54,539 | $199,637 |
| 2023 | $4,896 | $250,236 | $53,749 | $196,487 |
| 2022 | $4,473 | $205,484 | $37,940 | $167,544 |
| 2021 | $3,823 | $161,618 | $26,479 | $135,139 |
| 2020 | $3,520 | $147,323 | $24,503 | $122,820 |
| 2019 | $3,402 | $140,613 | $17,389 | $123,224 |
| 2018 | $3,178 | $128,305 | $14,623 | $113,682 |
| 2017 | $2,945 | $110,516 | $8,289 | $102,227 |
| 2016 | $2,403 | $89,457 | $0 | $0 |
| 2015 | $2,265 | $81,088 | $0 | $0 |
| 2014 | $1,943 | $72,551 | $0 | $0 |
Source: Public Records
Map
Nearby Homes
- 1057 Angora St
- 1152 Mccormick Dr
- 1101 Abagail Dr
- 1125 Wilmington Dr
- 1034 Falcon St
- 1381 Abagail Dr
- 968 Abagail Dr
- 1311 Abagail Dr
- 1074 Wilmington Dr
- 832 Yellowbird Ave
- 678 Fairchild Ave
- 1054 Windbrook Dr
- 1045 Windbrook Dr
- 1241 Section Line Trail
- 1118 Manitoba St
- 986 Clayton Dr
- 1363 Providence Blvd
- 930 Troy Dr
- 558 Tyler Ave
- 809 Westline Ave
- 1061 Pinder St
- 1061 Pinder St
- 1067 Pinder St
- 1048 Pioneer Dr
- 1044 Pioneer Dr
- 1049 Pinder St
- 1040 Pioneer Dr
- 1066 Pinder St
- 1060 Pinder St
- 1070 Pinder St
- 1056 Pioneer Dr
- 1056 Pinder St
- 1036 Pioneer Dr
- 1043 Pinder St
- 1052 Pioneer Dr
- 1079 Pinder St
- 1044 Pinder St
- 1032 Pioneer Dr
- 1060 Pioneer Dr
- 1055 Kenmore St