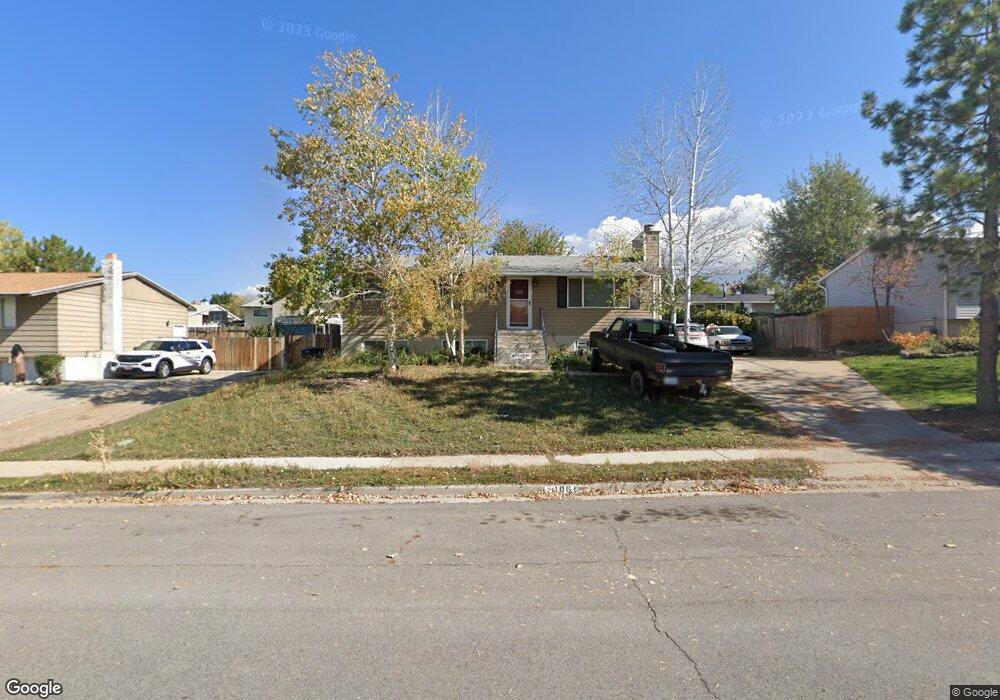
1061 S 730 W Payson, UT 84651
Estimated Value: $421,163 - $437,000
5
Beds
2
Baths
2,080
Sq Ft
$206/Sq Ft
Est. Value
About This Home
This home is located at 1061 S 730 W, Payson, UT 84651 and is currently estimated at $428,388, approximately $205 per square foot. 1061 S 730 W is a home located in Utah County with nearby schools including Wilson Elementary School, Payson Junior High School, and Mt. Nebo Middle.
Ownership History
Date
Name
Owned For
Owner Type
Purchase Details
Closed on
Jun 27, 2025
Sold by
Kennon Hanna and Kennon Mark
Bought by
Kennon Mark and Kennon Hanna
Current Estimated Value
Purchase Details
Closed on
Nov 5, 2019
Sold by
Cingolani Justin J and Cingolani Amanda L
Bought by
Kennon Mark and Williams Hanna
Home Financials for this Owner
Home Financials are based on the most recent Mortgage that was taken out on this home.
Original Mortgage
$261,616
Interest Rate
3.75%
Mortgage Type
New Conventional
Purchase Details
Closed on
Jun 28, 2018
Sold by
Cingolani Justin J and Cingolani Amanda L
Bought by
Cingolani Justin J and Cingolani Amanda L
Home Financials for this Owner
Home Financials are based on the most recent Mortgage that was taken out on this home.
Original Mortgage
$196,000
Interest Rate
4.6%
Mortgage Type
New Conventional
Purchase Details
Closed on
Sep 24, 2016
Sold by
Cingolani Justin
Bought by
Cingolani Justin J and Cingolani Amanda L
Home Financials for this Owner
Home Financials are based on the most recent Mortgage that was taken out on this home.
Original Mortgage
$170,000
Interest Rate
3.43%
Mortgage Type
New Conventional
Purchase Details
Closed on
Apr 17, 2014
Sold by
Nielson Jason M and Nielson Britney D
Bought by
Cingolani Justin J and Cingolani Amanda L
Home Financials for this Owner
Home Financials are based on the most recent Mortgage that was taken out on this home.
Original Mortgage
$168,367
Interest Rate
4.23%
Mortgage Type
New Conventional
Purchase Details
Closed on
Apr 26, 2001
Sold by
Searle Ronny K and Searle Trina A
Bought by
Nielson Jason M and Nielson Britney D
Home Financials for this Owner
Home Financials are based on the most recent Mortgage that was taken out on this home.
Original Mortgage
$116,669
Interest Rate
6.98%
Mortgage Type
FHA
Purchase Details
Closed on
Nov 19, 1997
Sold by
Searle Ronny and Searle Trina A
Bought by
Searle Ronny K and Searle Trina A
Home Financials for this Owner
Home Financials are based on the most recent Mortgage that was taken out on this home.
Original Mortgage
$76,000
Interest Rate
7.23%
Purchase Details
Closed on
Oct 24, 1996
Sold by
Peterson Trina A
Bought by
Searle Ronny and Searle Trina A
Create a Home Valuation Report for This Property
The Home Valuation Report is an in-depth analysis detailing your home's value as well as a comparison with similar homes in the area
Home Values in the Area
Average Home Value in this Area
Purchase History
| Date | Buyer | Sale Price | Title Company |
|---|---|---|---|
| Kennon Mark | -- | None Listed On Document | |
| Kennon Mark | -- | Truly Title Inc | |
| Cingolani Justin J | -- | Benchmark Title Ins Agency | |
| Cingolani Justin J | -- | Accommodation | |
| Cingolani Justin | -- | Highland Title | |
| Cingolani Justin J | -- | Keystone Title Ins Agen | |
| Nielson Jason M | -- | Pro Title & Escrow Inc | |
| Searle Ronny K | -- | -- | |
| Searle Ronny | -- | -- |
Source: Public Records
Mortgage History
| Date | Status | Borrower | Loan Amount |
|---|---|---|---|
| Previous Owner | Kennon Mark | $261,616 | |
| Previous Owner | Cingolani Justin J | $196,000 | |
| Previous Owner | Cingolani Justin | $170,000 | |
| Previous Owner | Cingolani Justin J | $168,367 | |
| Previous Owner | Nielson Jason M | $116,669 | |
| Previous Owner | Searle Ronny K | $76,000 |
Source: Public Records
Tax History
| Year | Tax Paid | Tax Assessment Tax Assessment Total Assessment is a certain percentage of the fair market value that is determined by local assessors to be the total taxable value of land and additions on the property. | Land | Improvement |
|---|---|---|---|---|
| 2025 | $2,037 | $222,750 | -- | -- |
| 2024 | $2,037 | $207,295 | $0 | $0 |
| 2023 | $2,026 | $206,800 | $0 | $0 |
| 2022 | $2,082 | $208,945 | $0 | $0 |
| 2021 | $1,686 | $271,400 | $89,600 | $181,800 |
| 2020 | $1,575 | $248,100 | $77,900 | $170,200 |
| 2019 | $1,397 | $225,500 | $71,100 | $154,400 |
| 2018 | $1,283 | $199,600 | $59,600 | $140,000 |
| 2017 | $1,193 | $99,825 | $0 | $0 |
| 2016 | $1,156 | $96,085 | $0 | $0 |
| 2015 | $1,046 | $86,350 | $0 | $0 |
| 2014 | $927 | $77,110 | $0 | $0 |
Source: Public Records
Map
Nearby Homes
- 528 W 1150 S
- 1172 S 880 W
- 1128 W 1150 S Unit 9
- 1116 W 1290 S
- 1152 W 1000 S
- 802 Brookside Ct
- 347 W 1380 S
- 1024 S 1170 W
- 1216 S 1150 W Unit 19
- 1192 W 1130 St S Unit 202
- 626 S 800 W Unit 32
- 588 W 1450 S
- 533 S 700 W
- 1531 S 910 W
- 527 S 1000 W
- 1463 S 260 W
- 609 W Saddlebrook Dr
- 613 W Saddlebrook Dr
- 1579 S 910 W
- 1631 S Highway 198
Your Personal Tour Guide
Ask me questions while you tour the home.