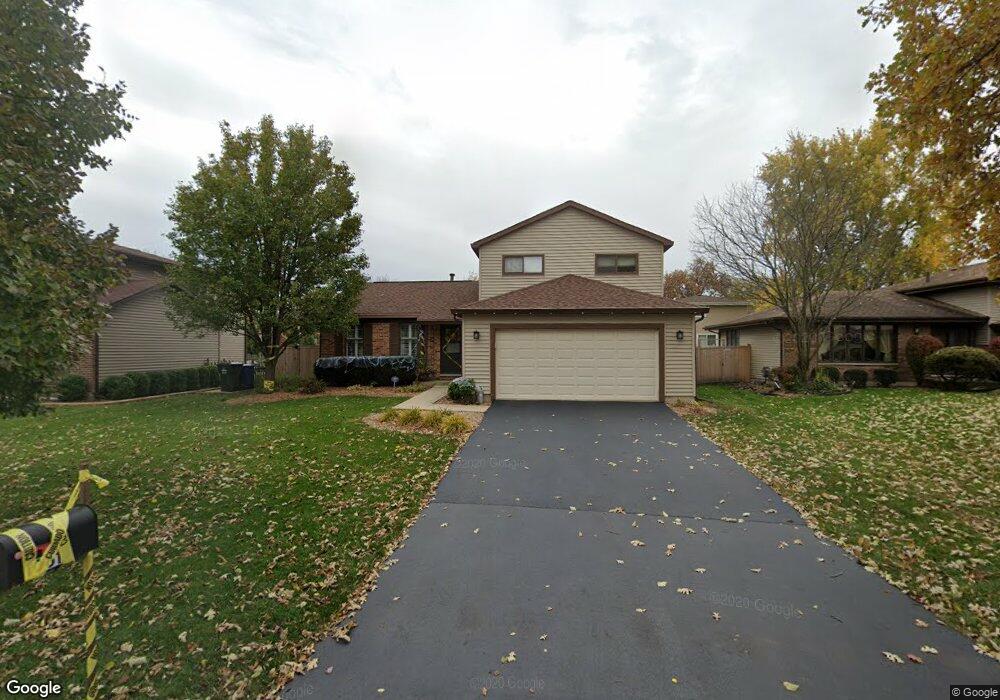
1061 Valley View Dr Downers Grove, IL 60516
South Downers Grove NeighborhoodEstimated Value: $456,000 - $471,548
3
Beds
2
Baths
1,496
Sq Ft
$310/Sq Ft
Est. Value
About This Home
This home is located at 1061 Valley View Dr, Downers Grove, IL 60516 and is currently estimated at $463,387, approximately $309 per square foot. 1061 Valley View Dr is a home located in DuPage County with nearby schools including Kingsley Elementary School, O'Neill Middle School, and Downers Grove South High School.
Ownership History
Date
Name
Owned For
Owner Type
Purchase Details
Closed on
Feb 9, 2022
Sold by
Scheldrip and Daniel
Bought by
Daniel Scheldrup And Melissa Scheldrip Revoca and Daniel Melissa S
Current Estimated Value
Purchase Details
Closed on
Jun 22, 2017
Sold by
Declaratio Gilfillan Beverly A and Declaratio Beverly A Gilfillan
Bought by
Zinnecker Melissa
Home Financials for this Owner
Home Financials are based on the most recent Mortgage that was taken out on this home.
Original Mortgage
$287,850
Interest Rate
3.87%
Mortgage Type
New Conventional
Purchase Details
Closed on
Sep 14, 2010
Sold by
Gilfillan Beverly A
Bought by
Declaratio Gilfillan Beverly A and Declaratio Beverly A Gilfillan
Purchase Details
Closed on
Jul 8, 2002
Sold by
Brunner Jessie and Gilfillan Beverly A
Bought by
Gilfillan Beverly A
Create a Home Valuation Report for This Property
The Home Valuation Report is an in-depth analysis detailing your home's value as well as a comparison with similar homes in the area
Home Values in the Area
Average Home Value in this Area
Purchase History
| Date | Buyer | Sale Price | Title Company |
|---|---|---|---|
| Daniel Scheldrup And Melissa Scheldrip Revoca | -- | Rogers Steven M | |
| Zinnecker Melissa | $303,000 | Baird Title | |
| Declaratio Gilfillan Beverly A | -- | None Available | |
| Gilfillan Beverly A | -- | -- |
Source: Public Records
Mortgage History
| Date | Status | Borrower | Loan Amount |
|---|---|---|---|
| Previous Owner | Zinnecker Melissa | $287,850 |
Source: Public Records
Tax History Compared to Growth
Tax History
| Year | Tax Paid | Tax Assessment Tax Assessment Total Assessment is a certain percentage of the fair market value that is determined by local assessors to be the total taxable value of land and additions on the property. | Land | Improvement |
|---|---|---|---|---|
| 2024 | $6,942 | $129,252 | $42,696 | $86,556 |
| 2023 | $6,587 | $118,820 | $39,250 | $79,570 |
| 2022 | $6,333 | $113,610 | $37,520 | $76,090 |
| 2021 | $5,926 | $112,310 | $37,090 | $75,220 |
| 2020 | $5,815 | $110,090 | $36,360 | $73,730 |
| 2019 | $5,627 | $105,630 | $34,890 | $70,740 |
| 2018 | $5,437 | $101,130 | $34,700 | $66,430 |
| 2017 | $5,260 | $97,310 | $33,390 | $63,920 |
| 2016 | $4,855 | $92,870 | $31,870 | $61,000 |
| 2015 | $4,777 | $87,370 | $29,980 | $57,390 |
| 2014 | $4,440 | $79,880 | $29,150 | $50,730 |
| 2013 | $4,347 | $79,500 | $29,010 | $50,490 |
Source: Public Records
Map
Nearby Homes
- 1036 Claremont Dr
- 7129 Matthias Rd
- 7125 Matthias Rd
- 7205 Kidwell Rd
- 6820 Barrett St
- 7123 Dunham Rd
- 7127 Dunham Rd
- 6901 Meadowcrest Dr
- 7315 Winthrop Way Unit 6
- 7318 Winthrop Way Unit 4
- 7412 Canterbury Place Unit 25
- 7419 Canterbury Place Unit 224
- 7333 Winthrop Way Unit 10
- 6610 Main St
- 6545 Main St Unit 408
- 6565 Main St Unit 401
- 6565 Main St Unit 204
- 6651 Dunham Rd
- 7501 Cambridge Rd
- 1029 Oxford St
- 1051 Valley View Dr
- 1101 Valley View Dr
- 1110 Hobart Ave
- 1120 Hobart Ave
- 1100 Hobart Ave
- 1111 Valley View Dr
- 6950 Waterfall Place
- 1050 Valley View Dr
- 1130 Hobart Ave
- 1121 Valley View Dr
- 1031 Valley View Dr
- 1040 Valley View Dr
- 1110 Valley View Dr
- 6940 Waterfall Place
- 1140 Hobart Ave
- 7061 Hobart Ave
- 1030 Valley View Dr
- 1021 Valley View Dr
- 1131 Valley View Dr
- 7071 Hobart Ave