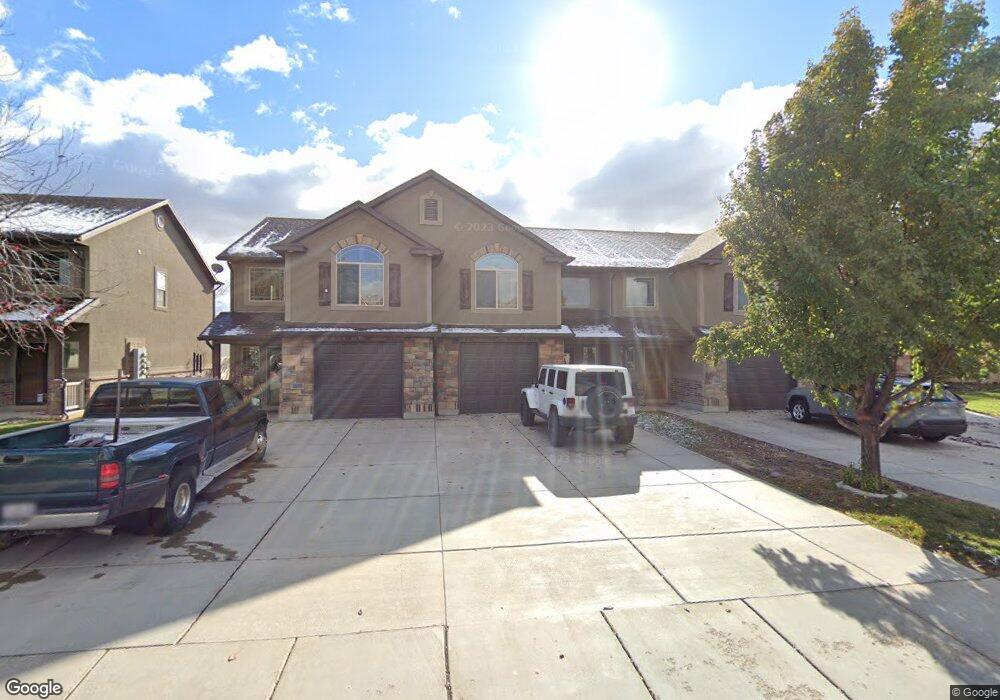
1061 W 950 N Layton, UT 84041
Estimated Value: $365,000 - $388,000
3
Beds
3
Baths
1,495
Sq Ft
$253/Sq Ft
Est. Value
About This Home
This home is located at 1061 W 950 N, Layton, UT 84041 and is currently estimated at $377,643, approximately $252 per square foot. 1061 W 950 N is a home located in Davis County with nearby schools including Central Davis Junior High School, Layton High School, and North Davis Preparatory Academy.
Ownership History
Date
Name
Owned For
Owner Type
Purchase Details
Closed on
Aug 25, 2020
Sold by
Lu Yunkai
Bought by
Lu Yunkai and Chang Li
Current Estimated Value
Purchase Details
Closed on
Jan 15, 2020
Sold by
Yang Yixiu
Bought by
Lu Yunkai
Purchase Details
Closed on
May 24, 2017
Sold by
Miller Jerry A
Bought by
Lu Yunkai
Home Financials for this Owner
Home Financials are based on the most recent Mortgage that was taken out on this home.
Original Mortgage
$160,000
Interest Rate
3.97%
Mortgage Type
Adjustable Rate Mortgage/ARM
Purchase Details
Closed on
Jul 1, 2008
Sold by
Nilson & Co Inc
Bought by
Miller Jerry A
Home Financials for this Owner
Home Financials are based on the most recent Mortgage that was taken out on this home.
Original Mortgage
$100,000
Interest Rate
5.56%
Mortgage Type
Purchase Money Mortgage
Create a Home Valuation Report for This Property
The Home Valuation Report is an in-depth analysis detailing your home's value as well as a comparison with similar homes in the area
Home Values in the Area
Average Home Value in this Area
Purchase History
| Date | Buyer | Sale Price | Title Company |
|---|---|---|---|
| Lu Yunkai | -- | None Available | |
| Lu Yunkai | -- | None Available | |
| Lu Yunkai | -- | Us Title Co | |
| Miller Jerry A | -- | Bonneville Superior Title Co |
Source: Public Records
Mortgage History
| Date | Status | Borrower | Loan Amount |
|---|---|---|---|
| Previous Owner | Lu Yunkai | $160,000 | |
| Previous Owner | Miller Jerry A | $100,000 |
Source: Public Records
Tax History Compared to Growth
Tax History
| Year | Tax Paid | Tax Assessment Tax Assessment Total Assessment is a certain percentage of the fair market value that is determined by local assessors to be the total taxable value of land and additions on the property. | Land | Improvement |
|---|---|---|---|---|
| 2025 | $1,823 | $191,400 | $57,200 | $134,200 |
| 2024 | $1,768 | $187,000 | $43,450 | $143,550 |
| 2023 | $1,808 | $185,350 | $41,800 | $143,550 |
| 2022 | $1,842 | $339,000 | $73,000 | $266,000 |
| 2021 | $1,703 | $257,000 | $60,000 | $197,000 |
| 2020 | $1,561 | $226,000 | $58,800 | $167,200 |
| 2019 | $1,502 | $213,000 | $56,500 | $156,500 |
| 2018 | $1,341 | $191,000 | $50,000 | $141,000 |
| 2016 | $1,192 | $87,560 | $15,400 | $72,160 |
| 2015 | $1,228 | $85,635 | $15,400 | $70,235 |
| 2014 | $1,160 | $82,679 | $18,333 | $64,346 |
| 2013 | -- | $87,415 | $15,400 | $72,015 |
Source: Public Records
Map
Nearby Homes
- 1171 W Gordon Ave
- 1366 N Main St Unit 5
- 1259 W 1050 N
- 1113 W Angel Hill Ct
- 1677 N 1600 W Unit 134
- 1133 Laytona Dr
- 1254 Marilyn Dr
- 1187 W Seraphim Ct
- 526 King St Unit 2
- 1500 N Angel St Unit 12
- 1456 Scott Cir
- 1615 N Angel St Unit F
- 1615 N Angel St Unit I
- 1615 N Angel St Unit E
- 1615 N Angel St Unit B
- 1615 N Angel St
- 1615 N Angel St Unit C
- 1615 N Angel St Unit H
- 1615 N Angel St Unit A
- 1615 N Angel St Unit G