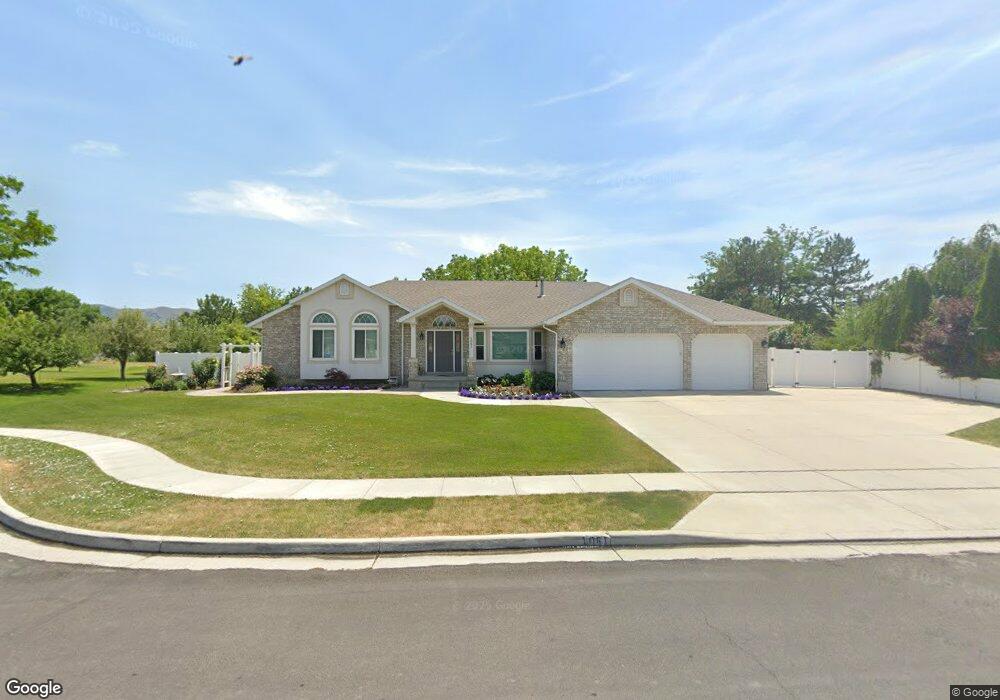
1061 W Windchime Cir Riverton, UT 84065
Estimated Value: $853,000 - $950,000
4
Beds
3
Baths
4,870
Sq Ft
$181/Sq Ft
Est. Value
About This Home
This home is located at 1061 W Windchime Cir, Riverton, UT 84065 and is currently estimated at $882,265, approximately $181 per square foot. 1061 W Windchime Cir is a home located in Salt Lake County with nearby schools including Rosamond Elementary School, Oquirrh Hills Middle School, and Riverton High School.
Ownership History
Date
Name
Owned For
Owner Type
Purchase Details
Closed on
Oct 10, 2014
Sold by
Day Kerry Lavon and Day Tamra Talbot
Bought by
The Kt Day Family Trust and Day Tamra Talbot
Current Estimated Value
Home Financials for this Owner
Home Financials are based on the most recent Mortgage that was taken out on this home.
Original Mortgage
$306,400
Outstanding Balance
$228,425
Interest Rate
3.37%
Mortgage Type
Adjustable Rate Mortgage/ARM
Estimated Equity
$653,840
Purchase Details
Closed on
Oct 8, 2014
Sold by
Nystrom David A and Nystrom Kaye M
Bought by
Day Kerry Lavon and Day Tamara Talbot
Home Financials for this Owner
Home Financials are based on the most recent Mortgage that was taken out on this home.
Original Mortgage
$306,400
Outstanding Balance
$228,425
Interest Rate
3.37%
Mortgage Type
Adjustable Rate Mortgage/ARM
Estimated Equity
$653,840
Purchase Details
Closed on
Nov 18, 1998
Sold by
Sorenson Russell L and Sorenson Susan L
Bought by
Nystrom David A and Nystrom Kaye W
Create a Home Valuation Report for This Property
The Home Valuation Report is an in-depth analysis detailing your home's value as well as a comparison with similar homes in the area
Home Values in the Area
Average Home Value in this Area
Purchase History
| Date | Buyer | Sale Price | Title Company |
|---|---|---|---|
| The Kt Day Family Trust | -- | Title Guarantee S Jordan | |
| Day Kerry Lavon | -- | Title Guarantee S Jordan | |
| Nystrom David A | -- | -- |
Source: Public Records
Mortgage History
| Date | Status | Borrower | Loan Amount |
|---|---|---|---|
| Open | The Kt Day Family Trust | $306,400 |
Source: Public Records
Tax History Compared to Growth
Tax History
| Year | Tax Paid | Tax Assessment Tax Assessment Total Assessment is a certain percentage of the fair market value that is determined by local assessors to be the total taxable value of land and additions on the property. | Land | Improvement |
|---|---|---|---|---|
| 2025 | $4,386 | $772,000 | $256,700 | $515,300 |
| 2024 | $4,386 | $759,100 | $252,000 | $507,100 |
| 2023 | $4,275 | $697,600 | $233,400 | $464,200 |
| 2022 | $4,463 | $714,400 | $228,800 | $485,600 |
| 2021 | $3,882 | $553,200 | $171,600 | $381,600 |
| 2020 | $3,750 | $498,300 | $153,800 | $344,500 |
| 2019 | $3,780 | $493,800 | $139,800 | $354,000 |
| 2018 | $3,612 | $464,500 | $139,800 | $324,700 |
| 2017 | $3,467 | $434,600 | $139,800 | $294,800 |
| 2016 | $3,380 | $406,500 | $122,800 | $283,700 |
| 2015 | $3,203 | $373,400 | $125,000 | $248,400 |
| 2014 | -- | $351,800 | $119,100 | $232,700 |
Source: Public Records
Map
Nearby Homes
- 1182 River Hills Dr
- 12091 S Lampton View Dr
- 1184 W Margaret Rose Dr
- 11860 S Alysum Cir
- 1337 Natasha Cir
- 11664 S Lampton View Dr
- 11622 S Halcom Dr Unit 601
- 11606 S Halcom Dr
- 12216 S 1300 W
- 11784 Stone Ridge Ct
- 1410 W 12115 S
- 1172 Country Ridge Dr
- 1182 Country Ridge Dr
- 11618 S Douglas Vista Dr
- 11711 Stone Crest Cir
- 12392 S 1300 W
- 11694 Stone Crest Cir
- 12566 S Tithing Hill Dr
- 12261 S Stephens View Cir
- 12294 S 1490 W
- 1061 Windchime Cir
- 1071 Windchime Cir
- 1066 W Silver River Cove
- 1085 W 11930 S
- 1041 Windchime Cir
- 1085 Windchime Cir
- 1072 Silver River Cove
- 1058 Silver River Cove
- 1062 Windchime Cir
- 1038 Windchime Cir
- 1074 Windchime Cir
- 1052 Windchime Cir
- 11972 S Lampton View Dr Unit 10
- 11972 Lampton View Dr
- 11984 S Lampton View Dr Unit 11
- 11984 S Lampton View Dr
- 11984 Lampton View Dr
- 11943 Buckwheat Way
- 1084 Windchime Cir
- 1084 W Windchime Cir