Estimated Value: $126,000 - $147,000
2
Beds
1
Bath
1,000
Sq Ft
$139/Sq Ft
Est. Value
About This Home
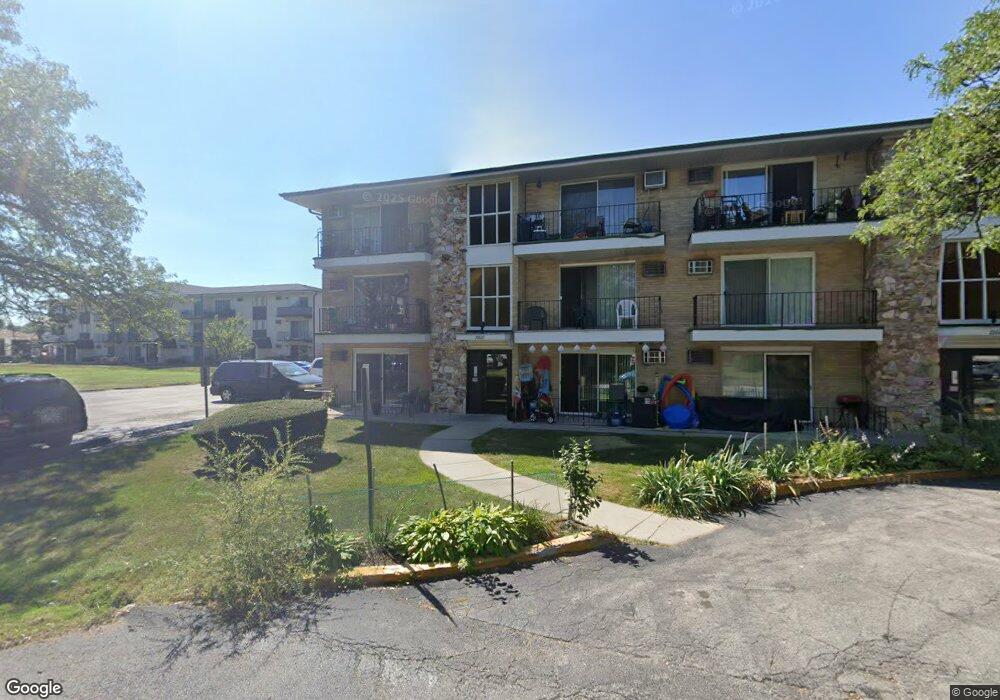
This home is located at 10610 S Depot St Unit 106101A, Worth, IL 60482 and is currently estimated at $139,338, approximately $139 per square foot. 10610 S Depot St Unit 106101A is a home located in Cook County with nearby schools including Worthwoods Elementary School, Worth Jr High School, and A B Shepard High School.
Ownership History
Date
Name
Owned For
Owner Type
Purchase Details
Closed on
May 13, 2019
Sold by
Mustafa Jalal
Bought by
Makp Properties Inc
Current Estimated Value
Home Financials for this Owner
Home Financials are based on the most recent Mortgage that was taken out on this home.
Original Mortgage
$37,100
Interest Rate
5.95%
Mortgage Type
Commercial
Purchase Details
Closed on
Jun 25, 2018
Sold by
Juba Tahani A D
Bought by
Mustafa Jalal
Purchase Details
Closed on
Mar 28, 2017
Sold by
Bitouni Warda Issa
Bought by
Juba Tahani A D
Purchase Details
Closed on
Oct 6, 2016
Sold by
Beituni Mamduh
Bought by
Bitouni Warda Issa
Purchase Details
Closed on
Aug 31, 2012
Sold by
Schaar H Ronald and Schaar Virginia D
Bought by
Beituni Mamduh
Purchase Details
Closed on
Sep 9, 2004
Sold by
Chicago Title Land Trust Co
Bought by
Schaar H Ronald and Schaar Virginia D
Create a Home Valuation Report for This Property
The Home Valuation Report is an in-depth analysis detailing your home's value as well as a comparison with similar homes in the area
Home Values in the Area
Average Home Value in this Area
Purchase History
| Date | Buyer | Sale Price | Title Company |
|---|---|---|---|
| Makp Properties Inc | $53,000 | Old Republic National Title | |
| Mustafa Jalal | -- | Attorney | |
| Juba Tahani A D | -- | None Available | |
| Bitouni Warda Issa | -- | None Available | |
| Beituni Mamduh | $30,000 | Old Republic National Title | |
| Schaar H Ronald | -- | -- |
Source: Public Records
Mortgage History
| Date | Status | Borrower | Loan Amount |
|---|---|---|---|
| Closed | Makp Properties Inc | $37,100 |
Source: Public Records
Tax History Compared to Growth
Tax History
| Year | Tax Paid | Tax Assessment Tax Assessment Total Assessment is a certain percentage of the fair market value that is determined by local assessors to be the total taxable value of land and additions on the property. | Land | Improvement |
|---|---|---|---|---|
| 2024 | $3,252 | $9,084 | $984 | $8,100 |
| 2023 | $2,321 | $9,084 | $984 | $8,100 |
| 2022 | $2,321 | $5,504 | $1,070 | $4,434 |
| 2021 | $2,234 | $5,503 | $1,069 | $4,434 |
| 2020 | $2,184 | $5,503 | $1,069 | $4,434 |
| 2019 | $2,867 | $6,830 | $984 | $5,846 |
| 2018 | $4,389 | $10,500 | $984 | $9,516 |
| 2017 | $4,386 | $10,500 | $984 | $9,516 |
| 2016 | $3,605 | $8,055 | $813 | $7,242 |
| 2015 | $3,539 | $8,055 | $813 | $7,242 |
| 2014 | $3,469 | $8,055 | $813 | $7,242 |
| 2013 | $2,234 | $5,758 | $813 | $4,945 |
Source: Public Records
Map
Nearby Homes
- 10609 Southwest Hwy Unit 2A
- 10528 Ridge Cove Dr Unit 11A
- 10508 Ridge Cove Dr Unit 18D
- 10600 S Highland Ave
- 10512 Ridge Cove Dr Unit 11C
- 10516 Ridge Cove Dr Unit 36C
- 7110 W 107th St Unit 16
- 10504 S Highland Ave Unit 1A
- 10501 S Highland Ave Unit 305
- 10718 S Worth Ave
- 10815 S 71st Ct
- 6806 W Lode Dr Unit 1B
- 6737 104th Place
- 7213 W 109th St
- 10930 S Worth Ave Unit 5
- 10817 S Oak Park Ave
- 10940 S Worth Ave Unit 1094011
- 10437 Natoma Ave Unit 6
- 10735 S Lloyd Dr
- 7357 W 109th St
- 10610 S Depot St Unit 106101B
- 10610 S Depot St Unit 10610GA
- 10610 S Depot St Unit 10610GB
- 10610 S Depot St Unit 106102A
- 10610 S Depot St Unit 106102B
- 10610 S Depot St Unit 2B
- 10610 S Depot St Unit 1A
- 10610 S Depot St Unit 2A
- 10610 S Depot St Unit GB
- 10604 S Depot St Unit 10604GB
- 10604 S Depot St Unit 10604GA
- 10604 S Depot St Unit 106042B
- 10604 S Depot St Unit 106041A
- 10604 S Depot St Unit 106041B
- 10604 S Depot St Unit 106042A
- 10604 S Depot St Unit GA
- 10604 S Depot St Unit 1A
- 10604 S Depot St Unit 1B
- 10604 S Depot St Unit 2B
- 10604 S Depot St Unit 1B