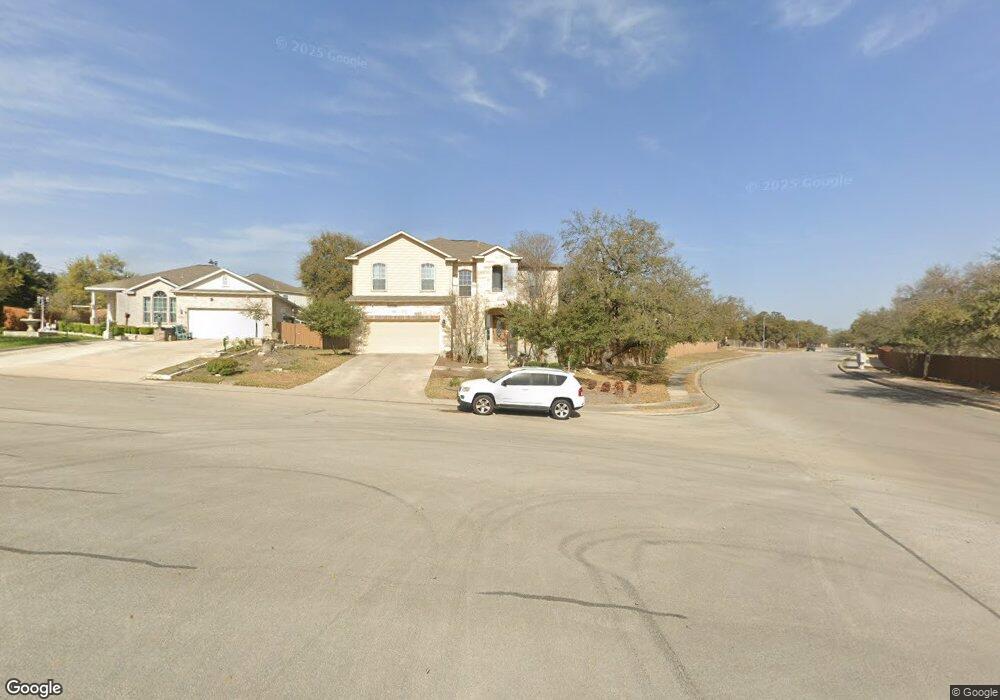
10611 Aster Canyon Helotes, TX 78023
Estimated Value: $377,000 - $448,000
5
Beds
4
Baths
3,698
Sq Ft
$114/Sq Ft
Est. Value
About This Home
This home is located at 10611 Aster Canyon, Helotes, TX 78023 and is currently estimated at $420,812, approximately $113 per square foot. 10611 Aster Canyon is a home located in Bexar County with nearby schools including Kuentz Elementary School, Jefferson Middle School, and O'Connor High School.
Ownership History
Date
Name
Owned For
Owner Type
Purchase Details
Closed on
Nov 1, 2012
Sold by
Bluestone Development I Ltd
Bought by
Davila Erik and Ramos Laura V
Current Estimated Value
Home Financials for this Owner
Home Financials are based on the most recent Mortgage that was taken out on this home.
Original Mortgage
$253,326
Outstanding Balance
$173,889
Interest Rate
3.25%
Mortgage Type
FHA
Estimated Equity
$246,923
Purchase Details
Closed on
Mar 10, 2010
Sold by
Armadillo Construction Company Ltd
Bought by
Bluestone Development I Ltd
Home Financials for this Owner
Home Financials are based on the most recent Mortgage that was taken out on this home.
Original Mortgage
$2,500,000
Interest Rate
4.95%
Mortgage Type
Purchase Money Mortgage
Create a Home Valuation Report for This Property
The Home Valuation Report is an in-depth analysis detailing your home's value as well as a comparison with similar homes in the area
Home Values in the Area
Average Home Value in this Area
Purchase History
| Date | Buyer | Sale Price | Title Company |
|---|---|---|---|
| Davila Erik | -- | First American Title | |
| Bluestone Development I Ltd | -- | Fatc |
Source: Public Records
Mortgage History
| Date | Status | Borrower | Loan Amount |
|---|---|---|---|
| Open | Davila Erik | $253,326 | |
| Previous Owner | Bluestone Development I Ltd | $2,500,000 |
Source: Public Records
Tax History Compared to Growth
Tax History
| Year | Tax Paid | Tax Assessment Tax Assessment Total Assessment is a certain percentage of the fair market value that is determined by local assessors to be the total taxable value of land and additions on the property. | Land | Improvement |
|---|---|---|---|---|
| 2025 | $10,663 | $460,880 | $63,730 | $397,150 |
| 2024 | $10,663 | $465,680 | $63,730 | $401,950 |
| 2023 | $10,663 | $465,310 | $63,730 | $401,580 |
| 2022 | $11,262 | $454,940 | $53,160 | $401,780 |
| 2021 | $8,686 | $338,820 | $48,340 | $290,480 |
| 2020 | $8,403 | $322,090 | $48,340 | $273,750 |
| 2019 | $8,032 | $299,820 | $44,000 | $255,820 |
| 2018 | $8,041 | $299,970 | $44,000 | $255,970 |
| 2017 | $7,697 | $286,640 | $44,000 | $242,640 |
| 2016 | $7,513 | $279,800 | $44,000 | $235,800 |
| 2015 | $6,631 | $272,630 | $44,000 | $228,630 |
| 2014 | $6,631 | $245,730 | $0 | $0 |
Source: Public Records
Map
Nearby Homes
- 10231 Roseangel Ln
- 11030 Chicory Field
- 10225 Braun Rd Unit A201
- 10225 Braun Rd Unit A310
- 10225 Braun Rd Unit C601
- 10225 Braun Rd Unit A302
- 10225 Braun Rd Unit A309
- 10607 Tansy Canyon
- 10223 Huisache Field
- 10523 Timber Country
- 10418 Alsfeld Ranch
- 10322 Alsfeld Ranch
- 10822 Red Sage
- 10714 Cactus Way
- 10639 Hibiscus Cove
- 10719 Serrento Hi
- 10707 Pharaoh Run
- 9951 Sandlet Trail
- 9950 Sandlet Trail
- 10706 Pharaoh Run
- 10607 Aster Canyon
- 10603 Aster Canyon
- 10718 Marot Field
- 10706 Marot Field
- 10714 Marot Field
- 10710 Marot Field
- 10602 Aster Canyon
- 10802 Marot Field
- 10610 Aster Canyon
- 10702 Marot Field
- 10606 Aster Canyon
- 10806 Marot Field Unit 1
- 10711 Marot Field
- 10707 Marot Field
- 10715 Marot Field
- 10810 Marot Field
- 10719 Marot Field
- 10703 Marot Field
- 10723 Marot Field
- 10803 Marot Field