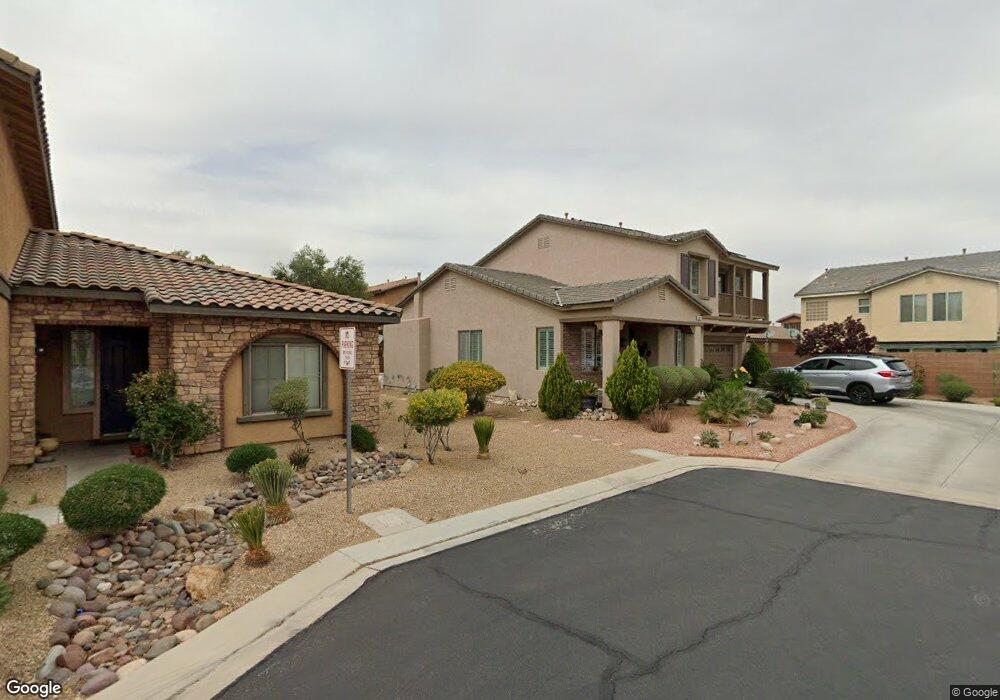
10611 Open Range Ct Las Vegas, NV 89179
Mountains Edge NeighborhoodEstimated Value: $528,856 - $557,000
4
Beds
3
Baths
2,602
Sq Ft
$209/Sq Ft
Est. Value
About This Home
This home is located at 10611 Open Range Ct, Las Vegas, NV 89179 and is currently estimated at $543,714, approximately $208 per square foot. 10611 Open Range Ct is a home located in Clark County with nearby schools including Jones Blackhurst Elementary School, Desert Oasis High School, and Doral Academy Cactus.
Ownership History
Date
Name
Owned For
Owner Type
Purchase Details
Closed on
Jul 14, 2021
Sold by
Castro Tess Tuibeo and Castro Arman Bachini
Bought by
Castro Tess Tuibeo and Castro Arman Bachini
Current Estimated Value
Home Financials for this Owner
Home Financials are based on the most recent Mortgage that was taken out on this home.
Original Mortgage
$329,600
Outstanding Balance
$296,455
Interest Rate
2.9%
Mortgage Type
New Conventional
Estimated Equity
$247,259
Purchase Details
Closed on
Jun 25, 2008
Sold by
Pardee Homes Of Nevada
Bought by
Castro Teresita T and Castro Armando B
Home Financials for this Owner
Home Financials are based on the most recent Mortgage that was taken out on this home.
Original Mortgage
$300,287
Interest Rate
6.5%
Mortgage Type
FHA
Create a Home Valuation Report for This Property
The Home Valuation Report is an in-depth analysis detailing your home's value as well as a comparison with similar homes in the area
Home Values in the Area
Average Home Value in this Area
Purchase History
| Date | Buyer | Sale Price | Title Company |
|---|---|---|---|
| Castro Tess Tuibeo | -- | Wfg National Title Compan | |
| Castro Teresita T | $315,000 | Chicago Title Las Vegas |
Source: Public Records
Mortgage History
| Date | Status | Borrower | Loan Amount |
|---|---|---|---|
| Open | Castro Tess Tuibeo | $329,600 | |
| Previous Owner | Castro Teresita T | $300,287 |
Source: Public Records
Tax History
| Year | Tax Paid | Tax Assessment Tax Assessment Total Assessment is a certain percentage of the fair market value that is determined by local assessors to be the total taxable value of land and additions on the property. | Land | Improvement |
|---|---|---|---|---|
| 2026 | $3,065 | $156,048 | $42,000 | $114,048 |
| 2025 | $2,975 | $155,421 | $40,250 | $115,171 |
| 2024 | $2,889 | $155,421 | $40,250 | $115,171 |
| 2023 | $2,889 | $148,898 | $40,250 | $108,648 |
| 2022 | $2,805 | $126,531 | $31,500 | $95,031 |
| 2021 | $2,613 | $122,800 | $29,750 | $93,050 |
| 2020 | $2,534 | $119,095 | $27,300 | $91,795 |
| 2019 | $2,460 | $115,498 | $25,550 | $89,948 |
| 2018 | $2,389 | $107,086 | $21,000 | $86,086 |
| 2017 | $2,917 | $99,465 | $21,000 | $78,465 |
| 2016 | $2,262 | $90,513 | $15,750 | $74,763 |
| 2015 | $2,257 | $79,847 | $12,250 | $67,597 |
| 2014 | $2,191 | $72,500 | $8,750 | $63,750 |
Source: Public Records
Map
Nearby Homes
- 10635 High Dormer Ct
- 10571 Aloe Springs St
- 7510 Perla Del Mar Ave
- 10530 La Campana St
- 10527 Peach Creek St
- 10751 Galveston Bay St
- 10838 Henesco Bay St
- 7279 Pepperbox Ave
- 10760 Centerville Bay Ct
- 7595 Peaceful Trellis Dr
- 7646 Monomoy Bay Ave
- 10743 Centerville Bay Ct
- 7595 Brisa Del Mar Ave
- 7629 Jasmine Falls Dr
- 7631 Peaceful Trellis Dr
- 10646 Cliff Lake St
- 7616 Eastham Bay Ave
- 7583 Wellfleet Bay Ave
- 7283 Sterling Rock Ave
- 7584 Engleberg Ave
- 10621 Open Range Ct
- 7425 Great Victoria Ave
- 7435 Great Victoria Ave
- 10614 High Dormer Ct
- 7415 Great Victoria Ave
- 10612 Open Range Ct
- 7443 Great Victoria Ave
- 10624 High Dormer Ct
- 10631 Open Range Ct
- 10622 Open Range Ct
- 10634 High Dormer Ct
- 7405 Great Victoria Ave
- 7451 Great Victoria Ave
- 10641 Open Range Ct
- 7426 Great Victoria Ave
- 10644 High Dormer Ct
- 7395 Great Victoria Ave
- 7436 Great Victoria Ave
- 7416 Great Victoria Ave
- 10615 High Dormer Ct
Your Personal Tour Guide
Ask me questions while you tour the home.