Estimated Value: $283,000 - $299,000
3
Beds
3
Baths
1,602
Sq Ft
$181/Sq Ft
Est. Value
About This Home
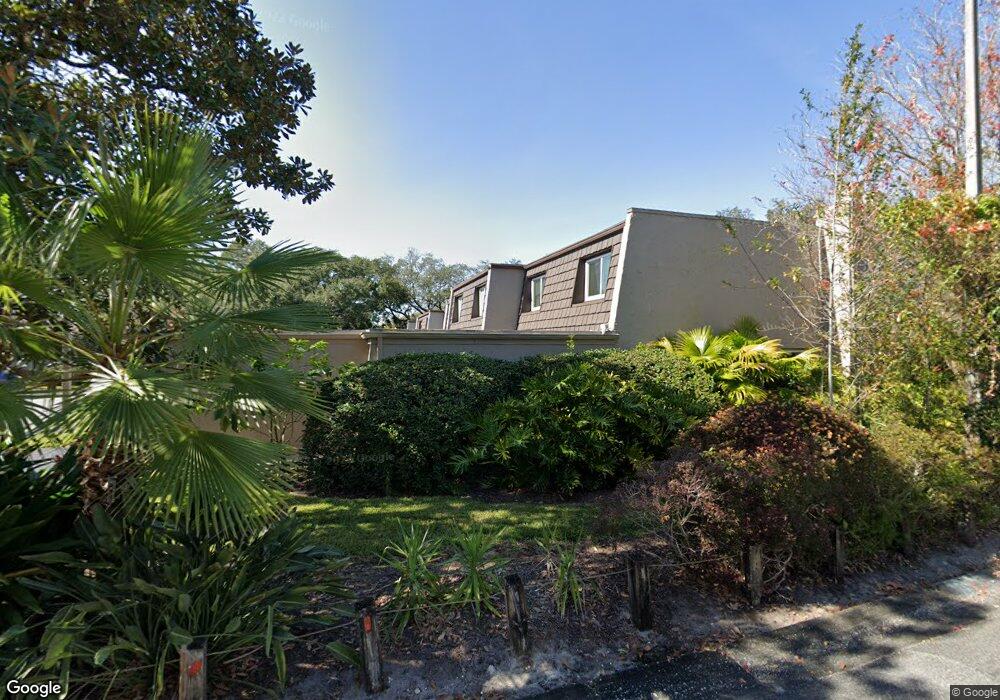
This home is located at 10612 Carrollbrook Ln, Tampa, FL 33618 and is currently estimated at $290,616, approximately $181 per square foot. 10612 Carrollbrook Ln is a home located in Hillsborough County with nearby schools including Carrollwood Elementary School, Chamberlain High School, and Corbett Preparatory School of IDS.
Ownership History
Date
Name
Owned For
Owner Type
Purchase Details
Closed on
Aug 31, 2021
Sold by
Jones Marshall G
Bought by
Rockwell John M and Rockwell Melanie Ann
Current Estimated Value
Home Financials for this Owner
Home Financials are based on the most recent Mortgage that was taken out on this home.
Original Mortgage
$190,000
Outstanding Balance
$172,628
Interest Rate
2.7%
Mortgage Type
Seller Take Back
Estimated Equity
$117,988
Purchase Details
Closed on
Mar 19, 2009
Sold by
Jones Tracy J
Bought by
Jones Marshall G
Purchase Details
Closed on
Oct 10, 2006
Sold by
Jones Marshall G
Bought by
Jones Tracy J
Purchase Details
Closed on
Oct 4, 1993
Sold by
Jones Marshall G
Bought by
Jones Tracy J and Jones Marshall G
Home Financials for this Owner
Home Financials are based on the most recent Mortgage that was taken out on this home.
Original Mortgage
$55,200
Interest Rate
6.9%
Create a Home Valuation Report for This Property
The Home Valuation Report is an in-depth analysis detailing your home's value as well as a comparison with similar homes in the area
Home Values in the Area
Average Home Value in this Area
Purchase History
| Date | Buyer | Sale Price | Title Company |
|---|---|---|---|
| Rockwell John M | $225,000 | Attorney | |
| Jones Marshall G | -- | Attorney | |
| Jones Tracy J | -- | Attorney | |
| Jones Tracy J | $27,271 | -- |
Source: Public Records
Mortgage History
| Date | Status | Borrower | Loan Amount |
|---|---|---|---|
| Open | Rockwell John M | $190,000 | |
| Previous Owner | Jones Tracy J | $55,200 |
Source: Public Records
Tax History Compared to Growth
Tax History
| Year | Tax Paid | Tax Assessment Tax Assessment Total Assessment is a certain percentage of the fair market value that is determined by local assessors to be the total taxable value of land and additions on the property. | Land | Improvement |
|---|---|---|---|---|
| 2024 | $5,028 | $218,371 | $100 | $218,271 |
| 2023 | $4,831 | $208,556 | $100 | $208,456 |
| 2022 | $4,447 | $189,043 | $100 | $188,943 |
| 2021 | $3,602 | $165,492 | $100 | $165,392 |
| 2020 | $3,265 | $140,998 | $100 | $140,898 |
| 2019 | $3,023 | $129,363 | $100 | $129,263 |
| 2018 | $2,923 | $128,655 | $0 | $0 |
| 2017 | $2,662 | $103,176 | $0 | $0 |
| 2016 | $2,485 | $87,443 | $0 | $0 |
| 2015 | $2,352 | $79,494 | $0 | $0 |
| 2014 | $2,315 | $77,517 | $0 | $0 |
| 2013 | -- | $82,884 | $0 | $0 |
Source: Public Records
Map
Nearby Homes
- 10604 Carrollbrook Ln
- 10423 Carrollbrook Cir Unit 102
- 10423 Carrollbrook Cir Unit 203
- 10415 Butia Place
- 10403 Lake Carroll Way
- 10316 Carrollwood Ct Unit 57
- 10330 Carrollwood Ln Unit 95
- 11237 Cedar Hollow Ln
- 10356 Carrollwood Ln Unit 204
- 11239 Cedar Hollow Ln
- 3307 Nakora Dr
- 3906 Floyd Rd
- 4308 Hudson Ln
- 9804 Lombard Ct Unit 104
- 3709 Greenery Ct Unit 209
- 3706 Greenery Ct Unit 206
- 4007 Hudson Ln
- 10415 Oakbrook Dr
- 11506 Galleria Dr
- 11507 N Grady Ave
- 10606 Carrollbrook Ln
- 10610 Carrollbrook Ln
- 10608 Carrollbrook Ln
- 10614 Carrollbrook Ln
- 10602 Carrollbrook Ln
- 10609 Carrollbrook Ln
- 10616 Carrollbrook Ln
- 10607 Carrollbrook Ln
- 10605 Carrollbrook Ln Unit 10605
- 10603 Carrollbrook Ln
- 10601 Carrollbrook Ln
- 10601 Carrollbrook Ln Unit 10601
- 10620 Carrollbrook Ln
- 10601 Carrollbrook Way Unit 10601
- 10622 Carrollbrook Ln
- 10602 Ilex St
- 3616 Schefflera Rd
- 10603 Carrollbrook Way
- 10453 Carrollbrook Cir Unit 222
- 10453 Carrollbrook Ct Unit 223