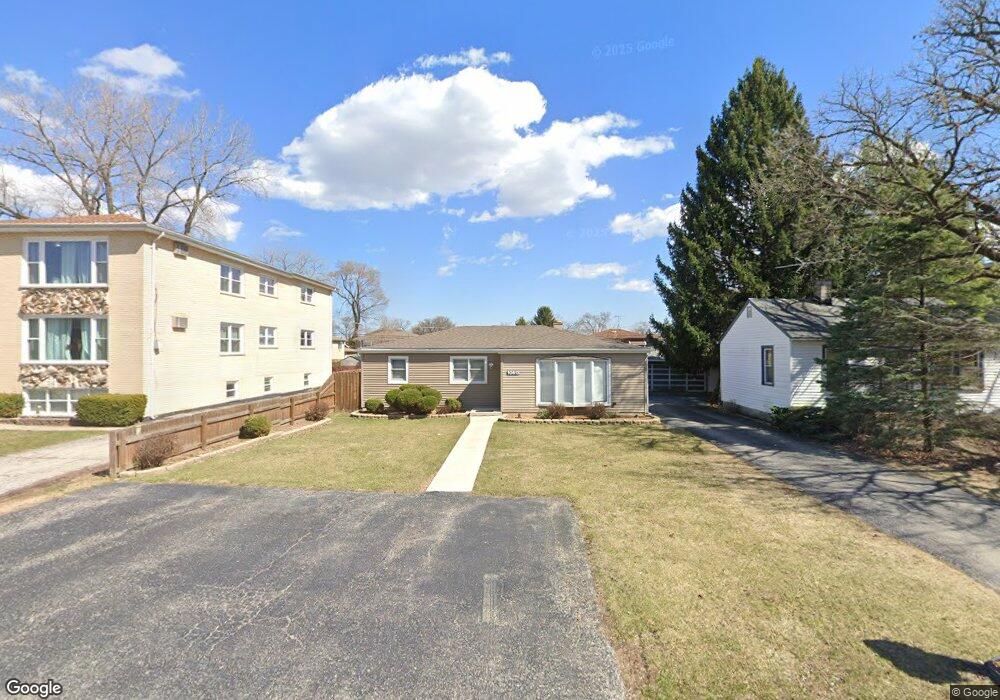
10613 S 81st Ct Palos Hills, IL 60465
Estimated Value: $261,000 - $335,000
3
Beds
1
Bath
1,166
Sq Ft
$251/Sq Ft
Est. Value
About This Home
This home is located at 10613 S 81st Ct, Palos Hills, IL 60465 and is currently estimated at $293,199, approximately $251 per square foot. 10613 S 81st Ct is a home located in Cook County with nearby schools including Sorrick Elementary School, Oak Ridge Elementary School, and H H Conrady Jr High School.
Ownership History
Date
Name
Owned For
Owner Type
Purchase Details
Closed on
Mar 30, 2004
Sold by
Graffe Kimberly
Bought by
Rodgers Shawn and Rodgers Lynn
Current Estimated Value
Home Financials for this Owner
Home Financials are based on the most recent Mortgage that was taken out on this home.
Original Mortgage
$33,800
Outstanding Balance
$16,026
Interest Rate
5.66%
Mortgage Type
Credit Line Revolving
Estimated Equity
$277,173
Purchase Details
Closed on
Jan 21, 2000
Sold by
Baur Mara M
Bought by
Graffe Kimberly
Home Financials for this Owner
Home Financials are based on the most recent Mortgage that was taken out on this home.
Original Mortgage
$117,800
Interest Rate
7.84%
Purchase Details
Closed on
Nov 16, 1999
Sold by
Baur Willard E and Baur Mara M
Bought by
Baur Mara M and Mara M Baur Trust
Create a Home Valuation Report for This Property
The Home Valuation Report is an in-depth analysis detailing your home's value as well as a comparison with similar homes in the area
Home Values in the Area
Average Home Value in this Area
Purchase History
| Date | Buyer | Sale Price | Title Company |
|---|---|---|---|
| Rodgers Shawn | $169,000 | Cti | |
| Graffe Kimberly | $124,000 | -- | |
| Baur Mara M | -- | -- | |
| Baur Willard E | -- | -- |
Source: Public Records
Mortgage History
| Date | Status | Borrower | Loan Amount |
|---|---|---|---|
| Open | Rodgers Shawn | $33,800 | |
| Open | Rodgers Shawn | $135,200 | |
| Previous Owner | Graffe Kimberly | $117,800 |
Source: Public Records
Tax History Compared to Growth
Tax History
| Year | Tax Paid | Tax Assessment Tax Assessment Total Assessment is a certain percentage of the fair market value that is determined by local assessors to be the total taxable value of land and additions on the property. | Land | Improvement |
|---|---|---|---|---|
| 2024 | $5,110 | $18,419 | $5,115 | $13,304 |
| 2023 | $5,710 | $21,000 | $5,115 | $15,885 |
| 2022 | $5,710 | $19,068 | $4,455 | $14,613 |
| 2021 | $5,565 | $19,068 | $4,455 | $14,613 |
| 2020 | $5,527 | $19,068 | $4,455 | $14,613 |
| 2019 | $4,893 | $17,621 | $4,125 | $13,496 |
| 2018 | $4,708 | $17,621 | $4,125 | $13,496 |
| 2017 | $4,560 | $17,621 | $4,125 | $13,496 |
| 2016 | $3,640 | $13,034 | $3,630 | $9,404 |
| 2015 | $3,546 | $13,034 | $3,630 | $9,404 |
| 2014 | $3,501 | $13,034 | $3,630 | $9,404 |
| 2013 | $3,598 | $14,111 | $3,630 | $10,481 |
Source: Public Records
Map
Nearby Homes
- 10531 S Roberts Rd Unit 2D
- 10820 Kathleen Ct Unit D
- 10441 S 83rd Ave
- 10324 S 81st Ave
- 10562 S 84th Ave
- 10927 Circle Dr
- 10926 Circle Ct
- 11001 Stony Creek Dr Unit 2C
- 8057 Valley Dr
- 10427 S Alta Dr
- 10845 S 84th Ave Unit 2A
- 10845 S 84th Ave Unit 2B
- 3 Stony Creek Dr Unit A
- 10226 S 81st Ave
- 11050 S Roberts Rd
- 10408 S Alta Dr
- 6 W Pebble Ct Unit A
- 10125 S 81st Ct
- 8202 Gruener Ct
- 11015 S 84th Ave Unit 3C
- 10615 S 81st Ct
- 10611 S 81st Ct Unit 1
- 10625 S 81st Ct
- 10607 S 81st Ct
- 10612 S 81st Ave
- 10610 S 81st Ave
- 10618 S 81st Ave
- 10627 S 81st Ct
- 10604 S 81st Ave
- 10630 S 81st Ave
- 10601 S 81st Ct Unit 2
- 10601 S 81st Ct Unit G
- 10601 S 81st Ct Unit 1
- 10628 S 81st Ave
- 10614 S 81st Ct
- 10633 S 81st Ct
- 10618 S 81st Ct
- 10612 S 81st Ct
- 10600 S 81st Ave
- 10620 S 81st Ct