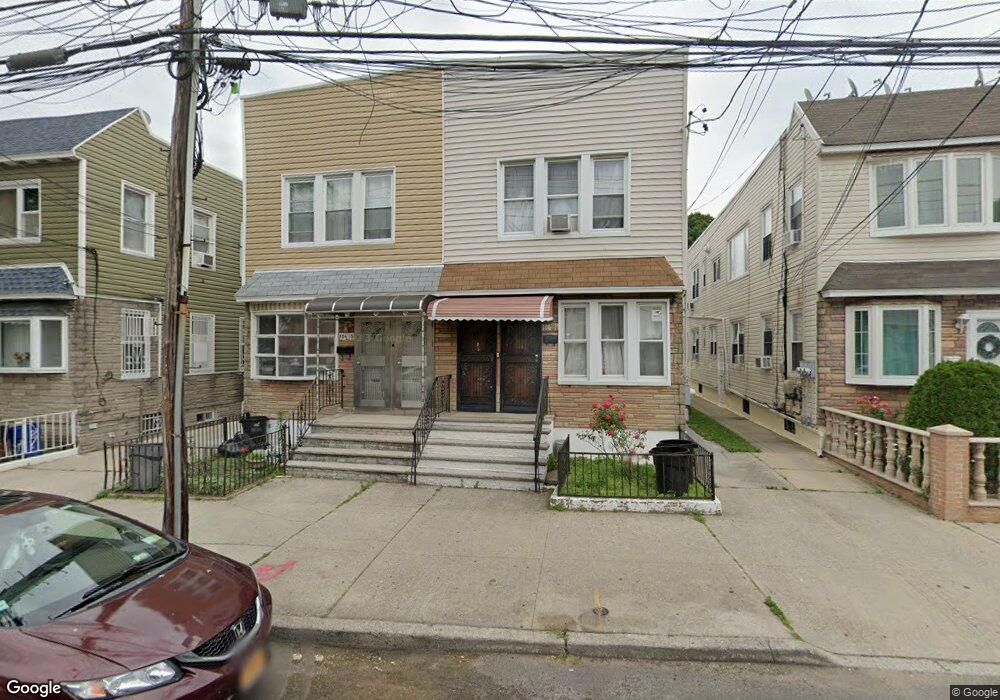
10617 79th St Ozone Park, NY 11417
Ozone Park NeighborhoodEstimated Value: $902,262 - $1,023,000
--
Bed
--
Bath
1,952
Sq Ft
$500/Sq Ft
Est. Value
About This Home
This home is located at 10617 79th St, Ozone Park, NY 11417 and is currently estimated at $975,066, approximately $499 per square foot. 10617 79th St is a home located in Queens County with nearby schools including P.S. 63 - Old South, Robert H. Goddard High School, and Cypress Hills Ascend Charter Lower School.
Ownership History
Date
Name
Owned For
Owner Type
Purchase Details
Closed on
Jun 12, 2024
Sold by
Hussain Sarwar
Bought by
Akther Mili Fathema and Haque Rezaul
Current Estimated Value
Home Financials for this Owner
Home Financials are based on the most recent Mortgage that was taken out on this home.
Original Mortgage
$731,250
Outstanding Balance
$721,918
Interest Rate
7.02%
Mortgage Type
Purchase Money Mortgage
Estimated Equity
$253,148
Purchase Details
Closed on
May 28, 2013
Sold by
Donna Guarasci As Executrix and Estate Of Margaret L Tomasino
Bought by
Hussain Sarwar
Home Financials for this Owner
Home Financials are based on the most recent Mortgage that was taken out on this home.
Original Mortgage
$404,804
Interest Rate
3.59%
Mortgage Type
New Conventional
Purchase Details
Closed on
May 19, 1994
Sold by
Tomasino Mamie
Bought by
Tomasino Margaret L
Create a Home Valuation Report for This Property
The Home Valuation Report is an in-depth analysis detailing your home's value as well as a comparison with similar homes in the area
Home Values in the Area
Average Home Value in this Area
Purchase History
| Date | Buyer | Sale Price | Title Company |
|---|---|---|---|
| Akther Mili Fathema | $975,000 | -- | |
| Hussain Sarwar | $425,000 | -- | |
| Hussain Sarwar | $425,000 | -- | |
| Tomasino Margaret L | -- | -- | |
| Tomasino Margaret L | -- | -- |
Source: Public Records
Mortgage History
| Date | Status | Borrower | Loan Amount |
|---|---|---|---|
| Open | Akther Mili Fathema | $731,250 | |
| Previous Owner | Hussain Sarwar | $404,804 |
Source: Public Records
Tax History Compared to Growth
Tax History
| Year | Tax Paid | Tax Assessment Tax Assessment Total Assessment is a certain percentage of the fair market value that is determined by local assessors to be the total taxable value of land and additions on the property. | Land | Improvement |
|---|---|---|---|---|
| 2025 | $7,231 | $39,628 | $11,085 | $28,543 |
| 2024 | $7,243 | $37,404 | $11,419 | $25,985 |
| 2023 | $6,886 | $35,686 | $10,619 | $25,067 |
| 2022 | $6,494 | $58,020 | $17,640 | $40,380 |
| 2021 | $6,852 | $49,620 | $17,640 | $31,980 |
| 2020 | $6,694 | $42,660 | $17,640 | $25,020 |
| 2019 | $6,228 | $40,800 | $17,640 | $23,160 |
| 2018 | $5,764 | $29,738 | $16,161 | $13,577 |
| 2017 | $5,470 | $28,305 | $15,972 | $12,333 |
| 2016 | $5,349 | $28,305 | $15,972 | $12,333 |
| 2015 | $2,782 | $27,519 | $18,786 | $8,733 |
| 2014 | $2,782 | $25,975 | $19,002 | $6,973 |
Source: Public Records
Map
Nearby Homes
- 10615 79th St
- 10619 79th St
- 10621 79th St
- 10623 79th St
- 10611 80th St
- 10613 79th St
- 106-13 79th St Unit 1st Fl
- 106-34 80th St
- 10611 79th St
- 10625 79th St
- 10627 79th St
- 106-19 79th St
- 10609 79th St
- 10609 79th St
- 10629 79th St
- 10644 79th St
- 10607 79th St
- 7912 Glenmore Ave
- 10605 79th St
- 7914 Glenmore Ave