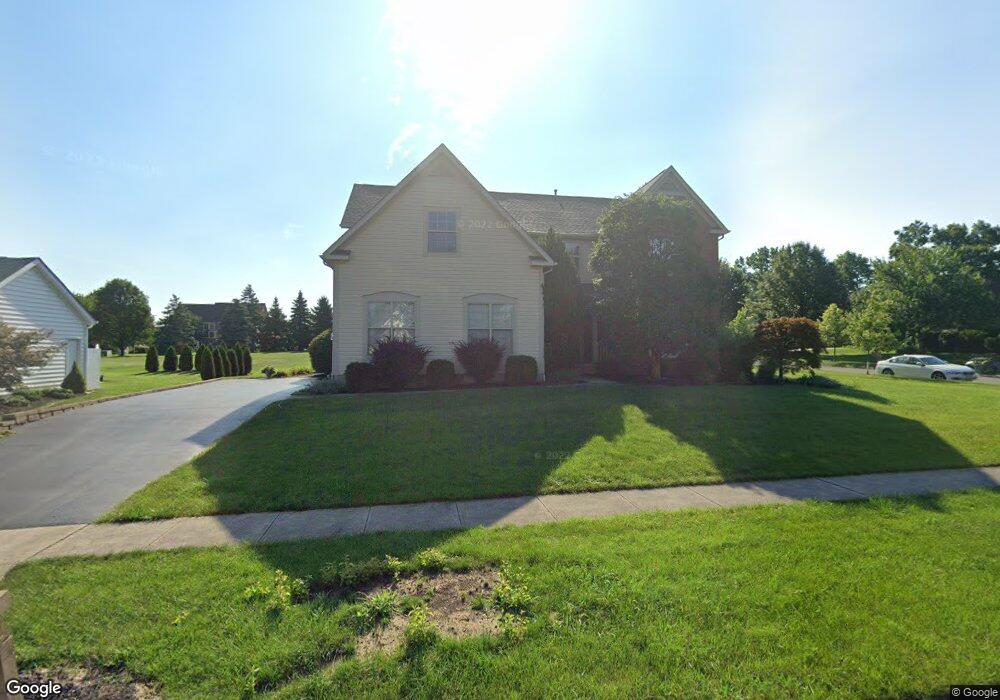
10617 Stoneham Dr Powell, OH 43065
Estimated Value: $591,000 - $663,000
4
Beds
3
Baths
3,078
Sq Ft
$200/Sq Ft
Est. Value
About This Home
This home is located at 10617 Stoneham Dr, Powell, OH 43065 and is currently estimated at $616,683, approximately $200 per square foot. 10617 Stoneham Dr is a home located in Delaware County with nearby schools including Tyler Run Elementary School, Olentangy Liberty Middle School, and Olentangy Liberty High School.
Ownership History
Date
Name
Owned For
Owner Type
Purchase Details
Closed on
Jun 23, 2006
Sold by
Mills Richard P and Mills Brenda J
Bought by
Stone Mills Brenda J
Current Estimated Value
Home Financials for this Owner
Home Financials are based on the most recent Mortgage that was taken out on this home.
Original Mortgage
$259,000
Outstanding Balance
$153,206
Interest Rate
6.68%
Mortgage Type
Purchase Money Mortgage
Estimated Equity
$463,477
Purchase Details
Closed on
Mar 7, 2002
Sold by
Virginia Homes Ltd
Bought by
Mills Richard P and Mills Brenda J
Home Financials for this Owner
Home Financials are based on the most recent Mortgage that was taken out on this home.
Original Mortgage
$234,600
Interest Rate
7.03%
Mortgage Type
New Conventional
Purchase Details
Closed on
Sep 6, 2001
Sold by
Boston Dev Co
Bought by
Virginia Homes Ltd
Home Financials for this Owner
Home Financials are based on the most recent Mortgage that was taken out on this home.
Original Mortgage
$198,500
Interest Rate
7.03%
Mortgage Type
New Conventional
Create a Home Valuation Report for This Property
The Home Valuation Report is an in-depth analysis detailing your home's value as well as a comparison with similar homes in the area
Home Values in the Area
Average Home Value in this Area
Purchase History
| Date | Buyer | Sale Price | Title Company |
|---|---|---|---|
| Stone Mills Brenda J | -- | None Available | |
| Mills Richard P | $293,349 | -- | |
| Virginia Homes Ltd | $103,500 | -- |
Source: Public Records
Mortgage History
| Date | Status | Borrower | Loan Amount |
|---|---|---|---|
| Open | Stone Mills Brenda J | $259,000 | |
| Previous Owner | Mills Richard P | $234,600 | |
| Previous Owner | Virginia Homes Ltd | $198,500 |
Source: Public Records
Tax History
| Year | Tax Paid | Tax Assessment Tax Assessment Total Assessment is a certain percentage of the fair market value that is determined by local assessors to be the total taxable value of land and additions on the property. | Land | Improvement |
|---|---|---|---|---|
| 2024 | $9,010 | $171,400 | $32,730 | $138,670 |
| 2023 | $9,045 | $171,400 | $32,730 | $138,670 |
| 2022 | $8,948 | $134,440 | $22,750 | $111,690 |
| 2021 | $9,485 | $134,440 | $22,750 | $111,690 |
| 2020 | $9,277 | $134,440 | $22,750 | $111,690 |
| 2019 | $7,845 | $121,590 | $22,750 | $98,840 |
| 2018 | $7,881 | $121,590 | $22,750 | $98,840 |
| 2017 | $7,417 | $112,950 | $20,370 | $92,580 |
| 2016 | $7,786 | $112,950 | $20,370 | $92,580 |
| 2015 | $7,042 | $112,950 | $20,370 | $92,580 |
| 2014 | $7,125 | $112,950 | $20,370 | $92,580 |
| 2013 | $7,117 | $110,250 | $20,370 | $89,880 |
Source: Public Records
Map
Nearby Homes
- 471 Commons Dr Unit 471
- 2672 Sawmill Reserve Dr Unit 2672
- 4933 Emerald Lakes Blvd Unit 4903
- 424 Whitaker Ave S
- 3910 Summit View Rd
- 2514 Tevis Ann Ct
- 255 Winter Hill Place
- 1937 Liberty St
- 97 Murphys Crossing Dr
- 120 S Liberty St
- 18 Murphys View Place Unit I18
- 10010 Beckford Ct
- 8622 Renford Ct
- 7844 Adare Ct Unit 5
- 7898 Sarahurst Dr
- 104 Encore Park Bend
- 4840 Paddington Way
- 3827 Carberry Dr Unit 3827
- 8292 Breckenridge Way
- 130 Barrington Place
- 10599 Stoneham Dr
- 3693 Waterbury Ln
- 3693 Waterbury Akne
- 10587 Stoneham Dr
- 3675 Waterbury Ln
- 3630 Waterbury Ln
- 3711 Waterbury Ln
- 3657 Waterbury Ln
- 10618 Stoneham Dr
- 3586 Waterbury Ln
- 10606 Stoneham Dr
- 3733 Waterbury Ln
- 10569 Stoneham Dr
- 10588 Stoneham Dr
- 3639 Waterbury Ln
- 3564 Waterbury Ln
- 3650 Bainbridge Mills Dr
- 3668 Bainbridge Mills Dr
- 3636 Bainbridge Mills Dr
- 3749 Waterbury Ln
Your Personal Tour Guide
Ask me questions while you tour the home.