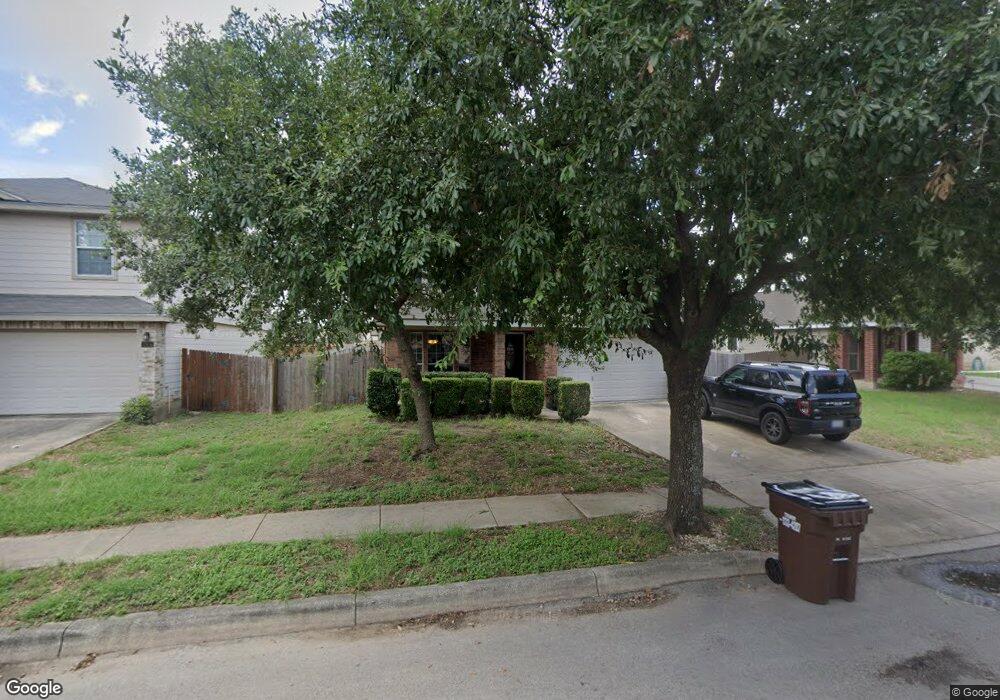
10618 Arabian Sands San Antonio, TX 78254
Estimated Value: $290,584 - $321,000
4
Beds
3
Baths
2,180
Sq Ft
$142/Sq Ft
Est. Value
About This Home
This home is located at 10618 Arabian Sands, San Antonio, TX 78254 and is currently estimated at $310,646, approximately $142 per square foot. 10618 Arabian Sands is a home located in Bexar County with nearby schools including Krueger Elementary School, Jefferson Middle School, and School of Science and Technology Hill Country.
Ownership History
Date
Name
Owned For
Owner Type
Purchase Details
Closed on
Apr 2, 2014
Sold by
Ferguson Kimberly
Bought by
Dewees Jeffrey Ryan
Current Estimated Value
Home Financials for this Owner
Home Financials are based on the most recent Mortgage that was taken out on this home.
Original Mortgage
$147,000
Outstanding Balance
$98,757
Interest Rate
4.38%
Mortgage Type
Purchase Money Mortgage
Estimated Equity
$211,889
Purchase Details
Closed on
Sep 22, 2010
Sold by
Ferguson Arnold
Bought by
Ferguson Kimberly
Purchase Details
Closed on
Dec 14, 2005
Sold by
Continental Homes Of Texas Lp
Bought by
Ferguson Arnold Gene and Ferguson Kimberly E
Home Financials for this Owner
Home Financials are based on the most recent Mortgage that was taken out on this home.
Original Mortgage
$159,225
Interest Rate
6.29%
Mortgage Type
VA
Create a Home Valuation Report for This Property
The Home Valuation Report is an in-depth analysis detailing your home's value as well as a comparison with similar homes in the area
Home Values in the Area
Average Home Value in this Area
Purchase History
| Date | Buyer | Sale Price | Title Company |
|---|---|---|---|
| Dewees Jeffrey Ryan | -- | Itc Stone Oak | |
| Ferguson Kimberly | -- | None Available | |
| Ferguson Arnold Gene | -- | Dhi Title |
Source: Public Records
Mortgage History
| Date | Status | Borrower | Loan Amount |
|---|---|---|---|
| Open | Dewees Jeffrey Ryan | $147,000 | |
| Previous Owner | Ferguson Arnold Gene | $159,225 |
Source: Public Records
Tax History Compared to Growth
Tax History
| Year | Tax Paid | Tax Assessment Tax Assessment Total Assessment is a certain percentage of the fair market value that is determined by local assessors to be the total taxable value of land and additions on the property. | Land | Improvement |
|---|---|---|---|---|
| 2025 | $4,304 | $300,240 | $59,390 | $240,850 |
| 2024 | $4,304 | $306,180 | $59,390 | $246,790 |
| 2023 | $4,304 | $279,038 | $59,390 | $253,060 |
| 2022 | $5,153 | $253,671 | $49,510 | $243,100 |
| 2021 | $4,855 | $230,610 | $45,090 | $185,520 |
| 2020 | $4,763 | $221,480 | $45,090 | $176,390 |
| 2019 | $4,736 | $213,260 | $34,850 | $178,410 |
| 2018 | $4,448 | $200,140 | $34,850 | $165,290 |
| 2017 | $4,321 | $194,040 | $34,850 | $159,190 |
| 2016 | $4,196 | $188,390 | $34,850 | $153,540 |
| 2015 | $3,771 | $179,110 | $34,850 | $144,260 |
| 2014 | $3,771 | $168,340 | $0 | $0 |
Source: Public Records
Map
Nearby Homes
- 10627 Arabian Sands
- 10707 Arabian Sands
- 9807 Sandlet Trail
- 9951 Sandlet Trail
- 9950 Sandlet Trail
- 9607 Country Shadow
- 10511 Marengo Ln
- 9726 Palomino Oaks
- 9427 Velvet Spring
- 9510 Caspian Forest
- 10814 Shetland Hills
- 9714 Connemara Bend
- 10706 Pharaoh Run
- 10322 Filly Valley
- 10707 Pharaoh Run
- 11019 Palomino Bend
- 10767 Pharaoh Run
- 9407 Pegasus Run Rd
- 10814 Mustang Oak Dr
- 10523 Timber Country
- 10614 Arabian Sands
- 10626 Arabian Sands
- 10610 Arabian Sands
- 10634 Arabian Sands
- 10611 Tiger Horse Cove
- 10606 Arabian Sands
- 10642 Arabian Sands
- 9646 Mustang Mesa
- 10619 Arabian Sands
- 9642 Mustang Mesa
- 10623 Arabian Sands
- 10615 Arabian Sands
- 10607 Tiger Horse Cove
- 9638 Mustang Mesa
- 10607 Arabian Sands
- 10602 Arabian Sands
- 10631 Arabian Sands
- 10615 Tiger Horse Cove
- 10646 Arabian Sands
- 10635 Arabian Sands