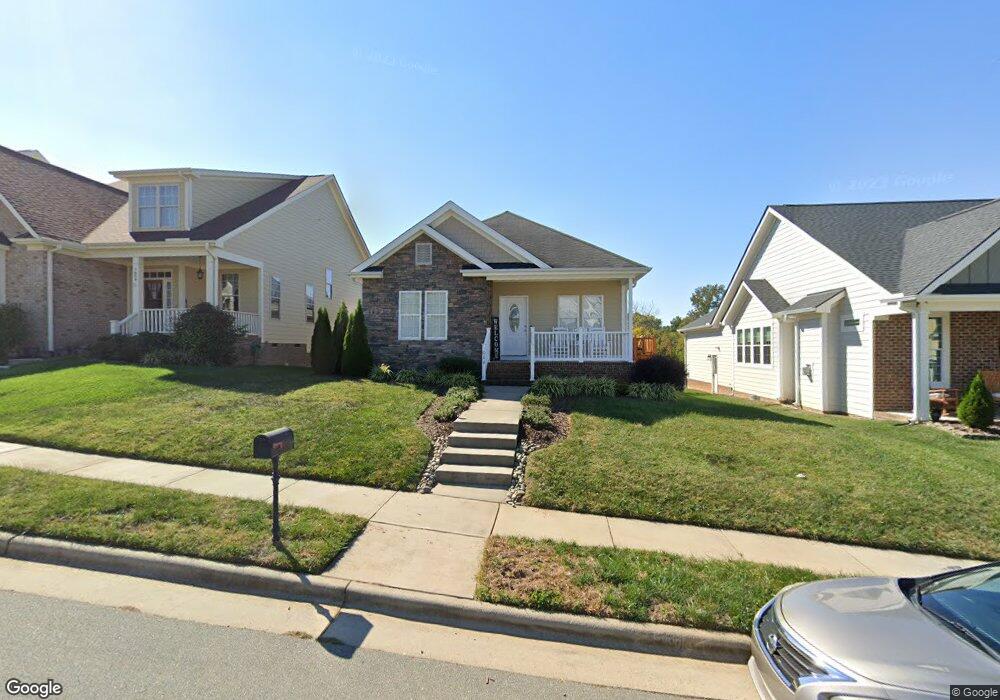
1062 Barn Owl Ave Haw River, NC 27258
Estimated Value: $327,316 - $391,000
3
Beds
2
Baths
1,562
Sq Ft
$229/Sq Ft
Est. Value
About This Home
This home is located at 1062 Barn Owl Ave, Haw River, NC 27258 and is currently estimated at $357,329, approximately $228 per square foot. 1062 Barn Owl Ave is a home located in Alamance County with nearby schools including Garrett Elementary School, Hawfields Middle School, and Alamance Community School.
Ownership History
Date
Name
Owned For
Owner Type
Purchase Details
Closed on
Jan 24, 2011
Sold by
L D Realty Inc and Kudron David J
Bought by
Stephens Rayfield
Current Estimated Value
Home Financials for this Owner
Home Financials are based on the most recent Mortgage that was taken out on this home.
Original Mortgage
$170,984
Outstanding Balance
$115,451
Interest Rate
4.58%
Mortgage Type
New Conventional
Estimated Equity
$241,878
Purchase Details
Closed on
May 27, 2010
Sold by
Crm Mid Altantic Properties Ll
Bought by
Ld Realty
Purchase Details
Closed on
Dec 8, 2009
Sold by
Prentis Richard F
Bought by
Crm Mid Atlantic Properties Ll
Purchase Details
Closed on
Nov 6, 2007
Sold by
Freeman Joseph E
Bought by
Altantic Custom Builders Llc
Purchase Details
Closed on
Sep 18, 2006
Sold by
Union Ridge Properties
Bought by
Freeman Joseph E
Home Financials for this Owner
Home Financials are based on the most recent Mortgage that was taken out on this home.
Original Mortgage
$34,600
Interest Rate
6.33%
Mortgage Type
New Conventional
Create a Home Valuation Report for This Property
The Home Valuation Report is an in-depth analysis detailing your home's value as well as a comparison with similar homes in the area
Home Values in the Area
Average Home Value in this Area
Purchase History
| Date | Buyer | Sale Price | Title Company |
|---|---|---|---|
| Stephens Rayfield | $165,000 | -- | |
| Ld Realty | $94,000 | -- | |
| Crm Mid Atlantic Properties Ll | $70,000 | -- | |
| Altantic Custom Builders Llc | $40,000 | -- | |
| Freeman Joseph E | $85,000 | -- |
Source: Public Records
Mortgage History
| Date | Status | Borrower | Loan Amount |
|---|---|---|---|
| Open | Stephens Rayfield | $170,984 | |
| Previous Owner | Freeman Joseph E | $34,600 |
Source: Public Records
Tax History Compared to Growth
Tax History
| Year | Tax Paid | Tax Assessment Tax Assessment Total Assessment is a certain percentage of the fair market value that is determined by local assessors to be the total taxable value of land and additions on the property. | Land | Improvement |
|---|---|---|---|---|
| 2025 | $1,481 | $299,733 | $50,000 | $249,733 |
| 2024 | $1,406 | $299,733 | $50,000 | $249,733 |
| 2023 | $1,288 | $299,733 | $50,000 | $249,733 |
| 2022 | $1,866 | $169,349 | $10,000 | $159,349 |
| 2021 | $1,883 | $169,349 | $10,000 | $159,349 |
| 2020 | $1,900 | $169,349 | $10,000 | $159,349 |
| 2019 | $1,905 | $169,349 | $10,000 | $159,349 |
| 2018 | $0 | $169,349 | $10,000 | $159,349 |
| 2017 | $977 | $169,349 | $10,000 | $159,349 |
| 2016 | $1,967 | $190,031 | $45,000 | $145,031 |
| 2015 | $1,097 | $190,031 | $45,000 | $145,031 |
| 2014 | -- | $190,031 | $45,000 | $145,031 |
Source: Public Records
Map
Nearby Homes
- at Old Fields
- CALI Plan at Old Fields
- WILMINGTON Plan at Old Fields
- Alec Plan at Old Fields
- COLUMBIA Plan at Old Fields
- GALEN Plan at Old Fields
- WINSTON Plan at Old Fields
- 1741 Old Fields Blvd
- 1739 Old Fields Blvd
- 1737 Old Fields Blvd
- 317 Single Tree Cir
- 1760 Post Oak Dr
- 1108 Orchard Stream Dr
- 1136 Orchard Stream Dr
- 1071 Cherry Stem Rd
- 908 Jimmie Kerr Rd
- 0 Jimmie Kerr Rd Unit 10127526
- 1915 Puffin Dr Unit Lot 198
- 1915 Puffin Dr
- 2180 Monk Dr
- 1062 Barn Owl Ave
- 1072 Barn Owl Ave
- 1072 Barn Owl Ave Unit 44
- 1054 Barn Owl Ave
- 1072 Barn Owl Dr
- 1072 Barn Owl Dr Unit 44
- 1078 Barn Owl Ave
- 1078 Barn Owl Ave Unit 45
- 1057 Barn Owl Dr
- 1057 Barn Owl Dr Unit 28
- 1020 Barn Owl Ave
- 1049 Barn Owl Ave
- 1038 Barn Owl Ave
- 1057 Barn Owl Ave
- 1030 Barn Owl Ave
- 1057 Barn Owl Ave Unit 28
- 1030 Barn Owl Ave Unit 39
- 1038 Barn Owl Ave Unit 40
- 1078 Barn Owl Ave Unit 45
- 1049 Barn Owl Ave Unit 29