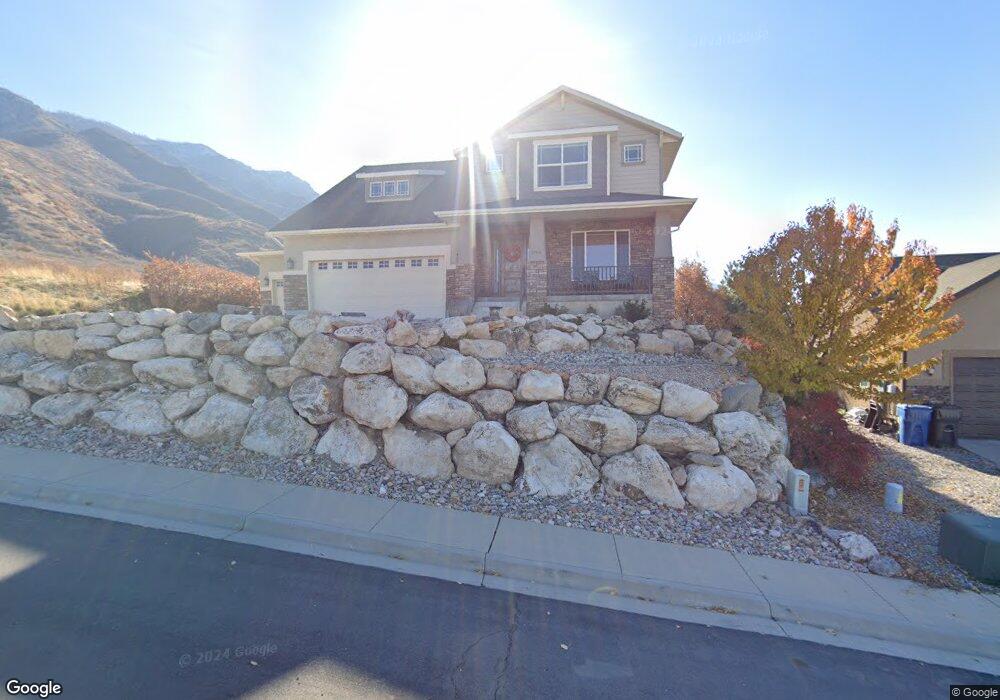
1062 E 430 S Santaquin, UT 84655
Estimated Value: $618,000 - $788,685
4
Beds
3
Baths
4,548
Sq Ft
$159/Sq Ft
Est. Value
About This Home
This home is located at 1062 E 430 S, Santaquin, UT 84655 and is currently estimated at $724,171, approximately $159 per square foot. 1062 E 430 S is a home located in Utah County with nearby schools including Orchard Hills Elementary School, Payson Junior High School, and Payson High School.
Ownership History
Date
Name
Owned For
Owner Type
Purchase Details
Closed on
Nov 23, 2020
Sold by
Mathwig Steven W and Mathwig Debra G
Bought by
Mathwig Steven Warren and Mathwig Debra Gretchen
Current Estimated Value
Home Financials for this Owner
Home Financials are based on the most recent Mortgage that was taken out on this home.
Original Mortgage
$182,200
Outstanding Balance
$131,605
Interest Rate
2.8%
Mortgage Type
New Conventional
Estimated Equity
$592,567
Purchase Details
Closed on
Jun 25, 2009
Sold by
The Loan Ranger Inc
Bought by
Mathwig Steven W and Mathwig Debra G
Home Financials for this Owner
Home Financials are based on the most recent Mortgage that was taken out on this home.
Original Mortgage
$253,162
Interest Rate
4.83%
Mortgage Type
Purchase Money Mortgage
Create a Home Valuation Report for This Property
The Home Valuation Report is an in-depth analysis detailing your home's value as well as a comparison with similar homes in the area
Home Values in the Area
Average Home Value in this Area
Purchase History
| Date | Buyer | Sale Price | Title Company |
|---|---|---|---|
| Mathwig Steven Warren | -- | Highland Title | |
| Mathwig Steven W | -- | Premier Title Insurance Age | |
| The Loan Ranger Inc | -- | Premier Title Insurance Age |
Source: Public Records
Mortgage History
| Date | Status | Borrower | Loan Amount |
|---|---|---|---|
| Open | Mathwig Steven Warren | $182,200 | |
| Closed | The Loan Ranger Inc | $253,162 | |
| Closed | Mathwig Steven W | $228,800 |
Source: Public Records
Tax History Compared to Growth
Tax History
| Year | Tax Paid | Tax Assessment Tax Assessment Total Assessment is a certain percentage of the fair market value that is determined by local assessors to be the total taxable value of land and additions on the property. | Land | Improvement |
|---|---|---|---|---|
| 2025 | $3,364 | $686,500 | $190,300 | $496,200 |
| 2024 | $3,364 | $335,005 | $0 | $0 |
| 2023 | $3,471 | $346,720 | $0 | $0 |
| 2022 | $3,222 | $332,035 | $0 | $0 |
| 2021 | $2,681 | $428,200 | $92,000 | $336,200 |
| 2020 | $2,586 | $400,200 | $80,000 | $320,200 |
| 2019 | $2,264 | $358,400 | $80,000 | $278,400 |
| 2018 | $2,214 | $334,100 | $76,200 | $257,900 |
| 2017 | $2,263 | $182,490 | $0 | $0 |
| 2016 | $2,158 | $170,500 | $0 | $0 |
| 2015 | $2,141 | $165,935 | $0 | $0 |
| 2014 | $1,875 | $144,980 | $0 | $0 |
Source: Public Records
Map
Nearby Homes
- 1171 E 430 S
- 1143 E 430 S
- 1153 E 270 S
- 160 S 940 E
- 65 S 940 E
- 942 N 160 E
- 942 N 160 E Unit 22
- 521 E 550 S
- 78 N Peach St
- 124 N Peach St
- 931 N 160 E Unit 11
- 1500 S 5200 W
- 4400 S Highway 198
- 4300 S Highway 198
- 13460 S Highway 6
- 1134 W Hidden Dr
- 13600 W Chimney Rock Pass S
- 2151 N York Ln Unit 11
- 14717 S 5200 W
- 576 S 400 E