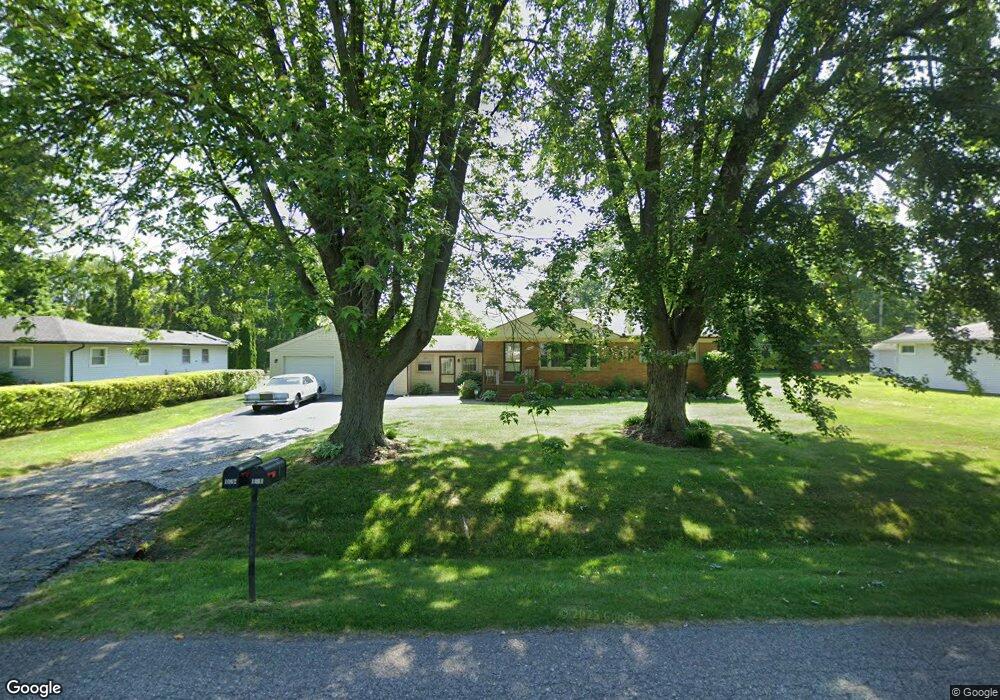
1062 Hira St Waterford, MI 48328
Waterford Township NeighborhoodEstimated Value: $232,000 - $287,000
3
Beds
1
Bath
1,100
Sq Ft
$235/Sq Ft
Est. Value
About This Home
This home is located at 1062 Hira St, Waterford, MI 48328 and is currently estimated at $258,674, approximately $235 per square foot. 1062 Hira St is a home located in Oakland County with nearby schools including Riverside Elementary School, Mason Middle School, and Waterford Mott High School.
Ownership History
Date
Name
Owned For
Owner Type
Purchase Details
Closed on
Oct 29, 2010
Sold by
Zerba Christopher and Zerba Julie
Bought by
Dietrich Paul
Current Estimated Value
Purchase Details
Closed on
May 25, 2010
Sold by
Secretary Of Veterans Affairs and Casey Judith
Bought by
Zerba Christopher
Purchase Details
Closed on
Jul 23, 2009
Sold by
Wells Fargo Bank Na
Bought by
Department Of Veterans Affairs
Purchase Details
Closed on
Jul 14, 2009
Sold by
Mcmillan Chauncey J and Mcmillan Brigitte M
Bought by
Wells Fargo Bank Na
Purchase Details
Closed on
Jun 30, 2004
Sold by
Schmitt Paul and Schmitt Kimberly
Bought by
Mcmillan Chauncey J and Mcmillan Brigitte M
Purchase Details
Closed on
Dec 26, 1997
Sold by
Hodges David E
Bought by
Schmitt Paul
Home Financials for this Owner
Home Financials are based on the most recent Mortgage that was taken out on this home.
Original Mortgage
$105,450
Interest Rate
7.08%
Purchase Details
Closed on
Jul 16, 1997
Sold by
Hodges E Jean
Bought by
Hodges David E
Create a Home Valuation Report for This Property
The Home Valuation Report is an in-depth analysis detailing your home's value as well as a comparison with similar homes in the area
Home Values in the Area
Average Home Value in this Area
Purchase History
| Date | Buyer | Sale Price | Title Company |
|---|---|---|---|
| Dietrich Paul | $90,000 | Interstate Title Inc | |
| Zerba Christopher | $55,000 | Progressive Title | |
| Department Of Veterans Affairs | -- | None Available | |
| Wells Fargo Bank Na | $70,945 | None Available | |
| Mcmillan Chauncey J | $169,900 | Triumph Title Agency Inc | |
| Schmitt Paul | $111,000 | -- | |
| Hodges David E | -- | -- |
Source: Public Records
Mortgage History
| Date | Status | Borrower | Loan Amount |
|---|---|---|---|
| Previous Owner | Schmitt Paul | $105,450 |
Source: Public Records
Tax History Compared to Growth
Tax History
| Year | Tax Paid | Tax Assessment Tax Assessment Total Assessment is a certain percentage of the fair market value that is determined by local assessors to be the total taxable value of land and additions on the property. | Land | Improvement |
|---|---|---|---|---|
| 2024 | $1,059 | $99,000 | $0 | $0 |
| 2023 | $1,011 | $80,480 | $0 | $0 |
| 2022 | $1,654 | $77,360 | $0 | $0 |
| 2021 | $1,571 | $68,720 | $0 | $0 |
| 2020 | $925 | $62,960 | $0 | $0 |
| 2019 | $1,536 | $59,930 | $0 | $0 |
| 2018 | $1,524 | $55,130 | $0 | $0 |
| 2017 | $1,399 | $55,130 | $0 | $0 |
| 2016 | $1,443 | $51,560 | $0 | $0 |
| 2015 | -- | $46,080 | $0 | $0 |
| 2014 | -- | $41,900 | $0 | $0 |
| 2011 | -- | $38,680 | $0 | $0 |
Source: Public Records
Map
Nearby Homes
- 1120 Orchid St
- 995 N Cass Lake Rd Unit 229
- 995 N Cass Lake Rd Unit 237
- 995 N Cass Lake Rd Unit 221
- 3062 Brookside Dr
- 1339 N Cass Lake Rd
- 3153 Megan Dr
- 2911 Mott Ave
- 3112 Hidden Ridge Dr Unit 2
- 1249 Woodlow St
- 3118 Harbor Ct
- 881 Tyrone Ave
- 27 Lake Village Ave
- 0000 Cheyenne
- 2960 Cottonwood Dr
- 798 Amberly Dr Unit B
- 3676 Mark Rd
- 3633 Richmond St
- 422 Fernbarry Dr
- 1797 Manse Rd
- 1044 Hira St
- 1080 Hira St
- 1065 Alhi St
- 1047 Alhi St
- 1083 Alhi St
- 1061 Hira St
- 1098 Hira St
- 1079 Hira St
- 1043 Hira St
- 3340 Pontiac Lake Rd
- 3326 Pontiac Lake Rd
- 1101 Alhi St
- 3312 Pontiac Lake Rd
- 1097 Hira St
- 1116 Hira St
- 3360 Pontiac Lake Rd
- 1084 Orchid St
- 3300 Pontiac Lake Rd Unit Bldg-Unit
- 3300 Pontiac Lake Rd
- 1119 Alhi St