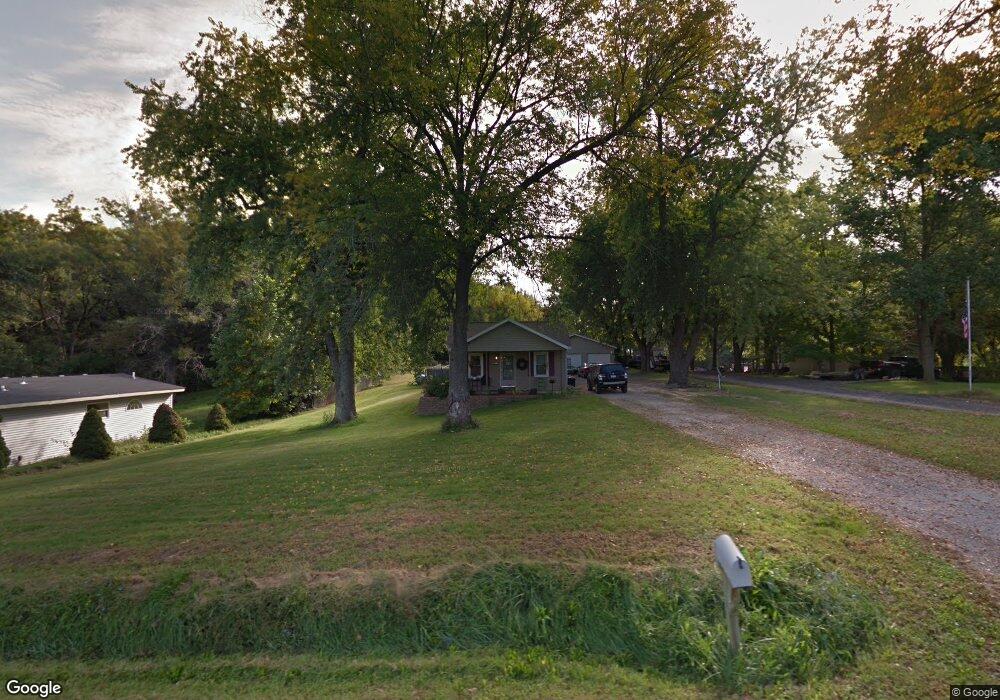
1062 Tansey Ave Unit 1 Springfield, IL 62712
Estimated Value: $129,000 - $174,000
1
Bed
1
Bath
1,320
Sq Ft
$114/Sq Ft
Est. Value
About This Home
This home is located at 1062 Tansey Ave Unit 1, Springfield, IL 62712 and is currently estimated at $151,136, approximately $114 per square foot. 1062 Tansey Ave Unit 1 is a home located in Sangamon County with nearby schools including Rochester Elementary Ec-1 School, Rochester Elementary School, and Rochester Intermediate School.
Ownership History
Date
Name
Owned For
Owner Type
Purchase Details
Closed on
Feb 15, 2008
Current Estimated Value
Purchase Details
Closed on
Sep 7, 2007
Purchase Details
Closed on
Jan 19, 2007
Purchase Details
Closed on
Apr 18, 2005
Purchase Details
Closed on
Aug 25, 1998
Purchase Details
Closed on
Oct 16, 1996
Create a Home Valuation Report for This Property
The Home Valuation Report is an in-depth analysis detailing your home's value as well as a comparison with similar homes in the area
Home Values in the Area
Average Home Value in this Area
Purchase History
| Date | Buyer | Sale Price | Title Company |
|---|---|---|---|
| -- | $50,000 | -- | |
| -- | -- | -- | |
| -- | -- | -- | |
| -- | -- | -- | |
| -- | $50,000 | -- | |
| -- | $54,800 | -- |
Source: Public Records
Tax History Compared to Growth
Tax History
| Year | Tax Paid | Tax Assessment Tax Assessment Total Assessment is a certain percentage of the fair market value that is determined by local assessors to be the total taxable value of land and additions on the property. | Land | Improvement |
|---|---|---|---|---|
| 2024 | $2,023 | $36,270 | $7,338 | $28,932 |
| 2023 | $1,969 | $34,451 | $6,970 | $27,481 |
| 2022 | $1,877 | $32,621 | $6,600 | $26,021 |
| 2021 | $1,789 | $31,318 | $6,336 | $24,982 |
| 2020 | $1,752 | $30,916 | $6,255 | $24,661 |
| 2019 | $1,723 | $31,118 | $6,296 | $24,822 |
| 2018 | $1,705 | $30,619 | $6,195 | $24,424 |
| 2017 | $1,677 | $30,294 | $6,129 | $24,165 |
| 2016 | $1,614 | $29,304 | $5,929 | $23,375 |
| 2015 | $1,601 | $29,040 | $5,876 | $23,164 |
| 2014 | $1,603 | $44,418 | $5,833 | $38,585 |
| 2013 | $1,575 | $28,706 | $5,150 | $23,556 |
Source: Public Records
Map
Nearby Homes
- 3535 E Cook St Unit 31
- 3011 Niccolls Rd
- 2991 Niccolls Rd
- 1105 Knoll Pointe Place
- 530 S Livingston St Unit 1
- 3309 E Carpenter St Unit 1
- 1905 Greentree Rd
- 3700 Viking Blvd
- 143 S Wesley St Unit 1
- 2331 South Grand Ave E
- 3121 E Carpenter St Unit 1
- 2310 E Kansas St
- 404 N Daniels Ave
- 2722 Walter Rd
- 66 White Birch Rd
- 184 Cravens Rd Unit 1
- 160 Forrest Ave Unit FP-35
- 10 Melody Ln Unit 1
- 2128 E Capitol Ave
- 300 Forrest Ave Unit 120
- 1048 Tansey Ave Unit 1
- 1140 Tansey Ave Unit 1
- 1156 Tansey Ave
- 1059 Tansey Ave
- 2981 Alpine Dr
- 2965 Alpine Dr
- 1091 Tansey Rd
- 2945 Alpine Dr
- 3714 South Grand Ave E Unit 1
- 3714 South Grand Ave E
- 2905 Alpine Dr
- 3709 South Grand Ave E Unit 1
- 2972 Alpine Dr
- 2865 Alpine Dr Unit 1
- 2900 Alpine Dr
- 3700 South Grand Ave E
- 3701 South Grand Ave E Unit 1
- 2870 Alpine Dr Unit 1
- 2825 Alpine Dr Unit 1
- 3643 South Grand Ave E