Estimated Value: $639,000 - $776,000
8
Beds
5
Baths
3,781
Sq Ft
$179/Sq Ft
Est. Value
About This Home
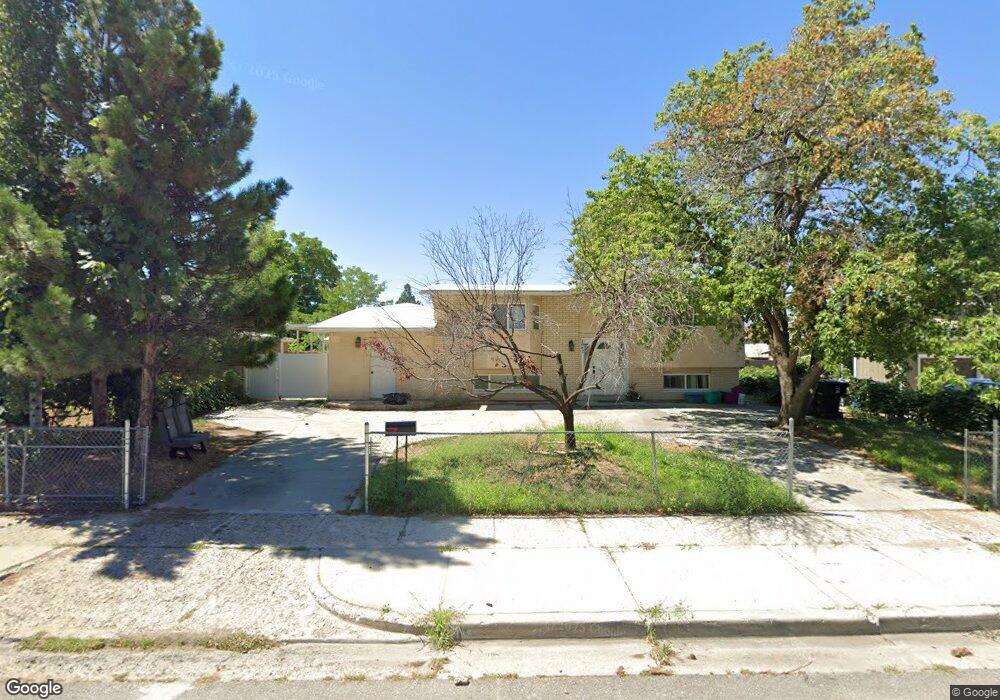
This home is located at 1062 Turquoise Way, Sandy, UT 84094 and is currently estimated at $675,191, approximately $178 per square foot. 1062 Turquoise Way is a home located in Salt Lake County with nearby schools including Crescent Elementary School, Eastmont Middle School, and Jordan High.
Ownership History
Date
Name
Owned For
Owner Type
Purchase Details
Closed on
Feb 14, 2025
Sold by
Isaacson Paul
Bought by
Isaacson Hope
Current Estimated Value
Home Financials for this Owner
Home Financials are based on the most recent Mortgage that was taken out on this home.
Original Mortgage
$493,213
Outstanding Balance
$490,294
Interest Rate
6.93%
Mortgage Type
New Conventional
Estimated Equity
$184,897
Purchase Details
Closed on
Mar 1, 2022
Sold by
Isaacson M
Bought by
Isaacson Laura and Isaacson Paul
Purchase Details
Closed on
Feb 23, 2010
Sold by
M S C Inc
Bought by
Isaacson M
Home Financials for this Owner
Home Financials are based on the most recent Mortgage that was taken out on this home.
Original Mortgage
$206,587
Interest Rate
4.97%
Mortgage Type
Seller Take Back
Purchase Details
Closed on
Jan 28, 2002
Sold by
Beagley Kent and Beagley Clela
Bought by
M S C Inc
Create a Home Valuation Report for This Property
The Home Valuation Report is an in-depth analysis detailing your home's value as well as a comparison with similar homes in the area
Home Values in the Area
Average Home Value in this Area
Purchase History
| Date | Buyer | Sale Price | Title Company |
|---|---|---|---|
| Isaacson Hope | -- | Chief Title | |
| Isaacson Hope | -- | Chief Title | |
| Isaacson Laura | -- | New Title Company Name | |
| Isaacson M | -- | None Available | |
| M S C Inc | -- | First American Title |
Source: Public Records
Mortgage History
| Date | Status | Borrower | Loan Amount |
|---|---|---|---|
| Open | Isaacson Hope | $493,213 | |
| Previous Owner | Isaacson M | $206,587 |
Source: Public Records
Tax History Compared to Growth
Tax History
| Year | Tax Paid | Tax Assessment Tax Assessment Total Assessment is a certain percentage of the fair market value that is determined by local assessors to be the total taxable value of land and additions on the property. | Land | Improvement |
|---|---|---|---|---|
| 2025 | $3,756 | $568,500 | $121,100 | $447,400 |
| 2024 | $3,756 | $562,000 | $113,200 | $448,800 |
| 2023 | $3,756 | $451,200 | $107,600 | $343,600 |
| 2022 | $3,257 | $471,600 | $105,500 | $366,100 |
| 2021 | $2,737 | $346,900 | $82,000 | $264,900 |
| 2020 | $2,874 | $327,700 | $82,000 | $245,700 |
| 2019 | $2,568 | $302,000 | $77,400 | $224,600 |
| 2018 | $2,187 | $252,200 | $77,400 | $174,800 |
| 2017 | $2,546 | $237,900 | $77,400 | $160,500 |
| 2016 | $2,666 | $244,000 | $77,400 | $166,600 |
| 2015 | $2,826 | $189,600 | $75,100 | $114,500 |
| 2014 | $2,275 | $188,800 | $76,600 | $112,200 |
Source: Public Records
Map
Nearby Homes
- 1058 S Turquoise Way
- 1077 S Turquoise Way
- 9968 S Flint Dr
- 1012 E Bell Dr
- 988 E Platinum Way
- 956 E Sego Lily Dr
- 9886 S Antimony Ln
- 959 E Violet Dr
- 1157 E Sego Lily Dr
- 9996 S Opal Cir
- 1060 E Sleepy Hollow Ln
- 9977 Lannae Dr
- 941 E Carnation Dr
- 9968 S Blossom Dr
- 954 E Carnation Dr
- 9633 S 1210 E
- 10165 S Zinnia Way
- 10109 S Peony Way
- 10433 S Carnation Dr
- 1100 E Webster Dr
- 1070 E Turquoise Way
- 1058 Turquoise Way
- 1058 E Turquoise Way
- 1058 E Turquoise Way Unit 30
- 1070 Turquoise Way
- 1047 Platinum Way
- 1041 E Platinum Way
- 1041 Platinum Way
- 1055 Platinum Way
- 1050 Turquoise Way
- 1076 Turquoise Way
- 1061 E Turquoise Way
- 1061 Turquoise Way
- 1069 S Turquoise Way
- 1069 Turquoise Way
- 1035 E Platinum Way
- 1035 Platinum Way
- 1061 E Platinum Way
- 1061 Platinum Way
- 1077 Turquoise Way