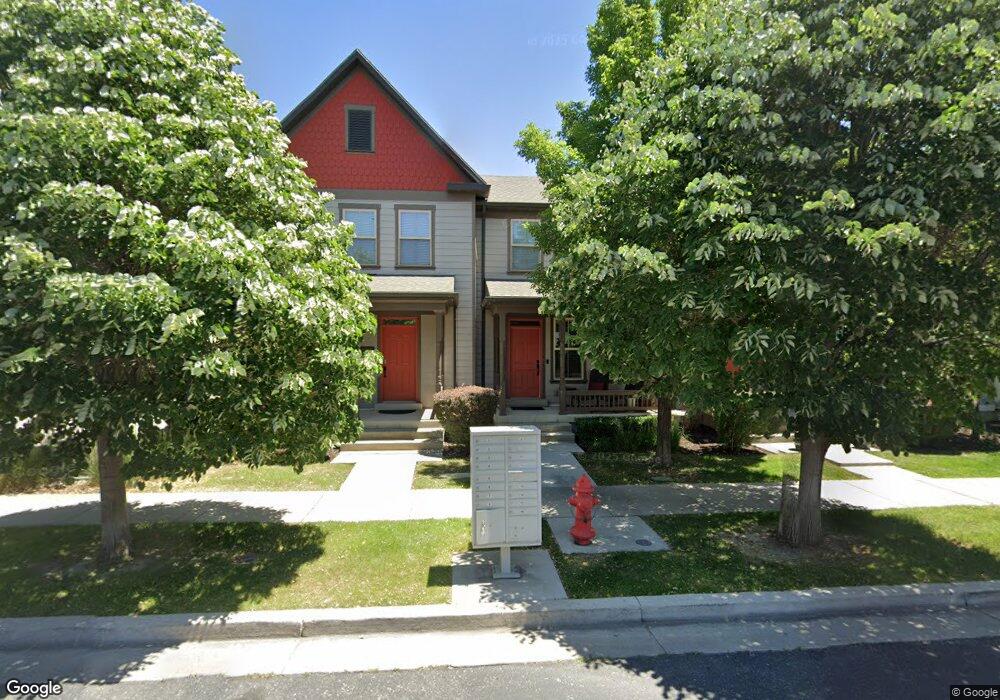
10621 S Topview Rd South Jordan, UT 84095
Daybreak NeighborhoodEstimated Value: $390,968 - $414,000
3
Beds
2
Baths
2,039
Sq Ft
$197/Sq Ft
Est. Value
About This Home
This home is located at 10621 S Topview Rd, South Jordan, UT 84095 and is currently estimated at $400,742, approximately $196 per square foot. 10621 S Topview Rd is a home located in Salt Lake County with nearby schools including Eastlake Elementary School, Mountain Creek Middle School, and Herriman High School.
Ownership History
Date
Name
Owned For
Owner Type
Purchase Details
Closed on
Apr 1, 2015
Sold by
Swenson Steven T and Swenson Ashley M
Bought by
Rasmussen Erik and Rasmussen Alexis
Current Estimated Value
Home Financials for this Owner
Home Financials are based on the most recent Mortgage that was taken out on this home.
Original Mortgage
$203,741
Outstanding Balance
$156,672
Interest Rate
3.71%
Mortgage Type
FHA
Estimated Equity
$244,070
Purchase Details
Closed on
Jan 10, 2013
Sold by
Daybreak Townhome Llc
Bought by
Swenson Steven T and Swenson Ashley M
Purchase Details
Closed on
Aug 31, 2010
Sold by
Betts Jason V
Bought by
Daybreak Townhomes Llc
Purchase Details
Closed on
Dec 30, 2008
Sold by
Hamlet Homes Ii Llc
Bought by
Betts Jason
Home Financials for this Owner
Home Financials are based on the most recent Mortgage that was taken out on this home.
Original Mortgage
$195,465
Interest Rate
6.03%
Mortgage Type
Unknown
Create a Home Valuation Report for This Property
The Home Valuation Report is an in-depth analysis detailing your home's value as well as a comparison with similar homes in the area
Home Values in the Area
Average Home Value in this Area
Purchase History
| Date | Buyer | Sale Price | Title Company |
|---|---|---|---|
| Rasmussen Erik | -- | Artisan Title | |
| Swenson Steven T | -- | Meridian Title | |
| Daybreak Townhomes Llc | -- | Us Title Park City | |
| Betts Jason | -- | Us Title Of Utah |
Source: Public Records
Mortgage History
| Date | Status | Borrower | Loan Amount |
|---|---|---|---|
| Open | Rasmussen Erik | $203,741 | |
| Previous Owner | Betts Jason | $195,465 |
Source: Public Records
Tax History Compared to Growth
Tax History
| Year | Tax Paid | Tax Assessment Tax Assessment Total Assessment is a certain percentage of the fair market value that is determined by local assessors to be the total taxable value of land and additions on the property. | Land | Improvement |
|---|---|---|---|---|
| 2025 | $1,901 | $367,600 | $53,600 | $314,000 |
| 2024 | $1,901 | $360,900 | $52,000 | $308,900 |
| 2023 | $2,008 | $359,700 | $50,500 | $309,200 |
| 2022 | $2,065 | $362,500 | $49,500 | $313,000 |
| 2021 | $1,608 | $259,000 | $38,200 | $220,800 |
| 2020 | $1,559 | $235,400 | $36,000 | $199,400 |
| 2019 | $1,589 | $235,800 | $36,000 | $199,800 |
| 2018 | $1,500 | $221,600 | $35,500 | $186,100 |
| 2017 | $1,445 | $209,100 | $35,500 | $173,600 |
| 2016 | $1,557 | $213,500 | $35,500 | $178,000 |
| 2015 | $1,450 | $193,300 | $43,000 | $150,300 |
| 2014 | $1,541 | $201,900 | $72,800 | $129,100 |
Source: Public Records
Map
Nearby Homes
- 10603 S Topview Rd
- 4518 W Cave Run Ln
- 10647 S Oquirrh Lake Rd
- 4498 W Talquin Ln
- 10741 S Topview Rd
- 4438 W South Jordan Pkwy
- 10663 Vermillion Dr W
- 10693 S Vermillion Dr
- 11054 S Lake Run Rd
- 10819 S Indigo Sky Way
- 10756 S Navarro Way
- 10891 S Topview Rd
- 4627 W Zig Zag Rd
- 10348 S Millerton Dr
- 4366 W Degray Dr
- 10566 S Lake Ave
- 10674 Pine Shadow Rd
- 10674 S Pine Shadow Rd
- 4091 W Juniper Hills Dr
- 4811 W Dock St
- 10621 Topview Rd
- 10623 S Topview Rd
- 10619 S Topview Rd
- 10619 S Topview Rd
- 10611 Topview Rd
- 10629 Topview Rd
- 10629 S Topview Rd
- 10617 Topview Rd
- 10633 Topview Rd
- 10623 Topview Rd
- 10637 S Topview Rd
- 10613 S Topview Rd
- 10637 Topview Rd
- 10613 S Topview Rd
- 10617 S Topview Rd
- 10611 S Topview Rd
- 10639 S Topview Rd
- 10626 S Ozarks Dr Unit 7-326
- 10626 S Ozarks Dr
- 10624 S Ozarks Dr Unit 7-325