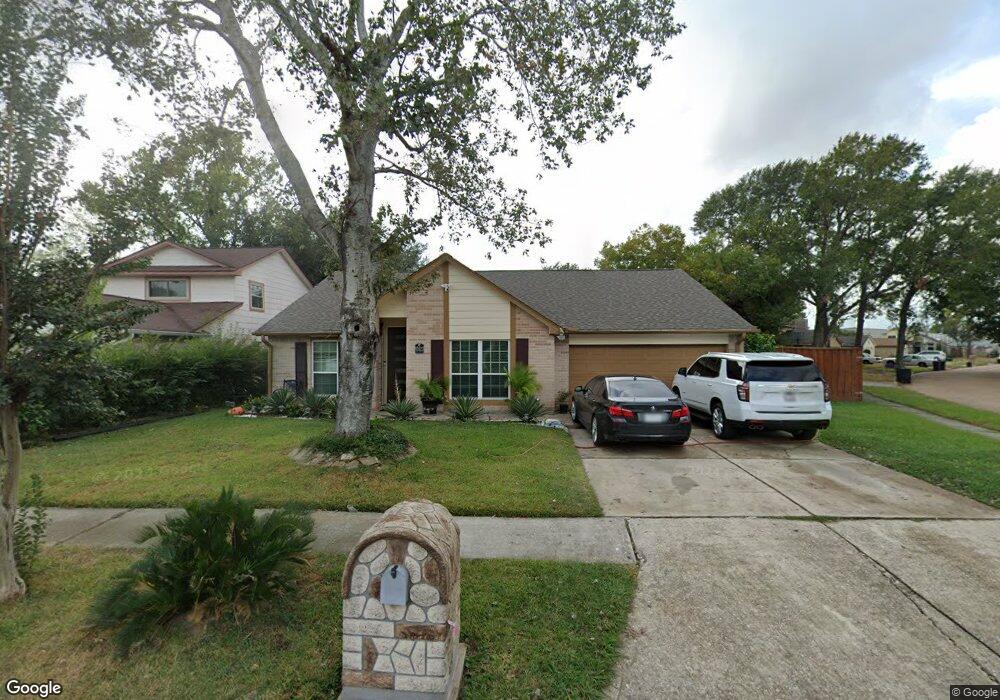
10623 Canyoncrest Ln Houston, TX 77086
North Houston NeighborhoodEstimated Value: $254,000 - $270,000
3
Beds
2
Baths
2,250
Sq Ft
$117/Sq Ft
Est. Value
About This Home
This home is located at 10623 Canyoncrest Ln, Houston, TX 77086 and is currently estimated at $262,311, approximately $116 per square foot. 10623 Canyoncrest Ln is a home located in Harris County with nearby schools including Kujawa EC/Pre-K/K School, Kujawa Elementary School, and Shotwell Middle School.
Ownership History
Date
Name
Owned For
Owner Type
Purchase Details
Closed on
Sep 22, 2006
Sold by
Vivas Fernando
Bought by
Gonzalez Rigoberto and Gonzalez Marla D
Current Estimated Value
Home Financials for this Owner
Home Financials are based on the most recent Mortgage that was taken out on this home.
Original Mortgage
$107,635
Outstanding Balance
$77,036
Interest Rate
10.55%
Mortgage Type
Purchase Money Mortgage
Estimated Equity
$185,275
Purchase Details
Closed on
Jan 1, 2005
Sold by
Burnett Forestry Llc
Bought by
Burnett Partners Ltd
Purchase Details
Closed on
May 4, 2000
Sold by
Drake Steavis M
Bought by
Vivas Fernando
Home Financials for this Owner
Home Financials are based on the most recent Mortgage that was taken out on this home.
Original Mortgage
$58,401
Interest Rate
10.75%
Create a Home Valuation Report for This Property
The Home Valuation Report is an in-depth analysis detailing your home's value as well as a comparison with similar homes in the area
Home Values in the Area
Average Home Value in this Area
Purchase History
| Date | Buyer | Sale Price | Title Company |
|---|---|---|---|
| Gonzalez Rigoberto | -- | First American Title | |
| Burnett Partners Ltd | -- | None Available | |
| Vivas Fernando | -- | Fidelity National Title |
Source: Public Records
Mortgage History
| Date | Status | Borrower | Loan Amount |
|---|---|---|---|
| Open | Gonzalez Rigoberto | $107,635 | |
| Previous Owner | Vivas Fernando | $58,401 | |
| Closed | Vivas Fernando | $6,489 |
Source: Public Records
Tax History Compared to Growth
Tax History
| Year | Tax Paid | Tax Assessment Tax Assessment Total Assessment is a certain percentage of the fair market value that is determined by local assessors to be the total taxable value of land and additions on the property. | Land | Improvement |
|---|---|---|---|---|
| 2025 | $2,877 | $276,951 | $39,348 | $237,603 |
| 2024 | $2,877 | $281,048 | $39,348 | $241,700 |
| 2023 | $2,877 | $286,573 | $39,348 | $247,225 |
| 2022 | $3,605 | $240,497 | $33,346 | $207,151 |
| 2021 | $3,269 | $198,139 | $33,346 | $164,793 |
| 2020 | $3,304 | $172,118 | $33,346 | $138,772 |
| 2019 | $3,123 | $157,404 | $14,718 | $142,686 |
| 2018 | $1,093 | $143,930 | $14,718 | $129,212 |
| 2017 | $2,489 | $143,930 | $14,718 | $129,212 |
| 2016 | $2,262 | $125,429 | $14,718 | $110,711 |
| 2015 | $1,586 | $125,429 | $14,718 | $110,711 |
| 2014 | $1,586 | $92,481 | $14,718 | $77,763 |
Source: Public Records
Map
Nearby Homes
- 7302 Seton Lake Dr
- 10614 Mackenzie Dr
- 10307 Bammel North Houston Rd
- 10723 Mackenzie Dr
- 10711 Heather Hill Dr
- 7307 Silver Star Dr
- 7023 Sandswept Ln
- 7218 Winding Trace Dr
- 7002 Sandswept Ln
- 7222 Northleaf Dr
- 6911 Silver Star Dr
- 7227 Greenyard Dr
- 6822 Dusty Dawn Dr
- 9815 Lonsford Dr
- 6722 Winding Trace Dr
- 6830 Desert Rose Ln
- 7011 Lower Arrow Dr
- 11007 Tobasa Ct
- 6654 Brownie Campbell Rd
- 9707 Rapid River Ln
- 10619 Canyoncrest Ln
- 7311 Rogue River Dr
- 10615 Canyoncrest Ln
- 7315 Rogue River Dr
- 7322 Mundare Ln
- 7326 Mundare Ln
- 7310 Rogue River Dr
- 7314 Rogue River Dr
- 7318 Mundare Ln
- 10611 Canyoncrest Ln
- 10622 Canyoncrest Ln
- 7306 Rogue River Dr
- 7403 Rogue River Dr
- 10618 Canyoncrest Ln
- 7330 Mundare Ln
- 7402 Rogue River Dr
- 10614 Canyoncrest Ln
- 7314 Mundare Ln
- 7302 Rogue River Dr
- 10607 Canyoncrest Ln