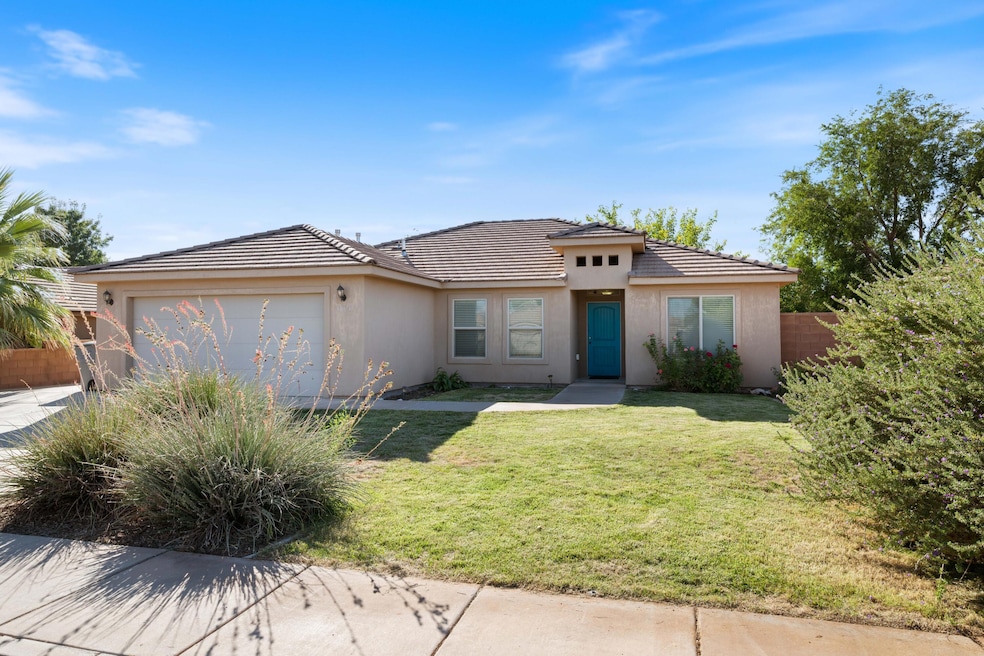
1063 Camel Springs Dr Washington, UT 84780
Estimated payment $2,667/month
Highlights
- Vaulted Ceiling
- Covered Patio or Porch
- Double Pane Windows
- No HOA
- Attached Garage
- Soaking Tub
About This Home
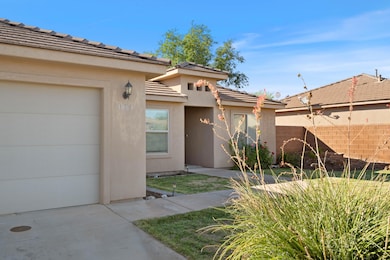
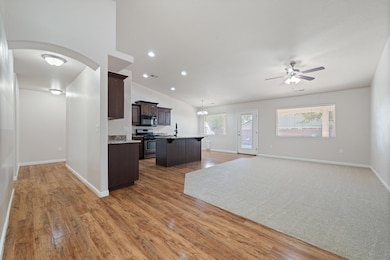
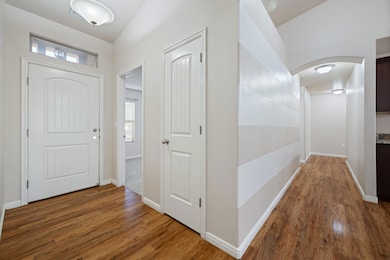
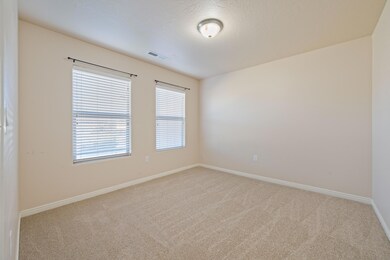
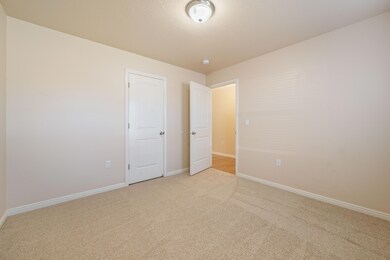
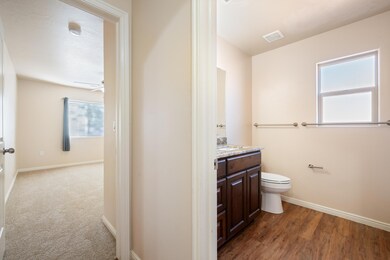
Beautifully maintained 4 bed, 2 bath home in Warm Springs! This single-level 1,780 sq. ft. home features vaulted ceilings, vinyl hardwood flooring, and brand new carpet. The kitchen boasts granite counters, center island with sink, stainless appliances & gas range, opening to a spacious great room and dining area. Primary suite offers dual vanity, soaking tub, shower & walk-in closet. Enjoy a fully landscaped yard with covered patio, paved sitting area, mature trees & block wall privacy. 2-car garage plus RV parking. No HOA! Close to schools, parks, shopping & minutes from the freeway!

Home Details
Home Type
- Single Family
Est. Annual Taxes
- $1,642
Year Built
- Built in 2012
Lot Details
- 6,970 Sq Ft Lot
- Partially Fenced Property
- Landscaped
- Sprinkler System
Parking
- Attached Garage
Home Design
- Asphalt Roof
- Stucco Exterior
Interior Spaces
- 1,728 Sq Ft Home
- 1-Story Property
- Vaulted Ceiling
- Ceiling Fan
- Double Pane Windows
Bedrooms and Bathrooms
- 4 Bedrooms
- 2 Bathrooms
- Soaking Tub
- Garden Bath
Outdoor Features
- Covered Patio or Porch
Schools
- Sandstone Elementary School
- Pine View Middle School
- Pine View High School
Utilities
- No Cooling
- Central Air
- Heating System Uses Natural Gas
Community Details
- No Home Owners Association
- New Warm Springs Subdivision
Listing and Financial Details
- Assessor Parcel Number W-NWSS-5-534
Map
Home Values in the Area
Average Home Value in this Area
Tax History
| Year | Tax Paid | Tax Assessment Tax Assessment Total Assessment is a certain percentage of the fair market value that is determined by local assessors to be the total taxable value of land and additions on the property. | Land | Improvement |
|---|---|---|---|---|
| 2025 | $1,675 | $249,645 | $66,000 | $183,645 |
| 2023 | $1,678 | $251,790 | $57,750 | $194,040 |
| 2022 | $1,758 | $248,270 | $49,500 | $198,770 |
| 2021 | $1,543 | $324,100 | $55,000 | $269,100 |
| 2020 | $1,468 | $291,600 | $55,000 | $236,600 |
| 2019 | $1,377 | $267,100 | $50,000 | $217,100 |
| 2018 | $1,414 | $141,790 | $0 | $0 |
| 2017 | $1,296 | $126,445 | $0 | $0 |
| 2016 | $1,322 | $119,405 | $0 | $0 |
| 2015 | $1,287 | $111,870 | $0 | $0 |
| 2014 | $1,245 | $108,900 | $0 | $0 |
Property History
| Date | Event | Price | List to Sale | Price per Sq Ft |
|---|---|---|---|---|
| 10/24/2025 10/24/25 | Pending | -- | -- | -- |
| 10/03/2025 10/03/25 | For Sale | $479,999 | -- | $278 / Sq Ft |
Purchase History
| Date | Type | Sale Price | Title Company |
|---|---|---|---|
| Warranty Deed | -- | First American Title Ins Co | |
| Interfamily Deed Transfer | -- | Provo Land Title Co | |
| Warranty Deed | -- | Meridian Title Company | |
| Warranty Deed | -- | Meridian Title Company | |
| Warranty Deed | -- | Meridian Title Company | |
| Trustee Deed | $2,000,000 | Meridian Title Company |
Mortgage History
| Date | Status | Loan Amount | Loan Type |
|---|---|---|---|
| Previous Owner | $174,677 | FHA |
Source: Washington County Board of REALTORS®
MLS Number: 25-265697
APN: 0870754
Disclaimer: Certain information contained herein is derived from information provided by parties other than Homes.com. All information provided is deemed reliable, but is not guaranteed to be accurate and should be independently verified.
![]() All information should be verified by the recipient and none is guaranteed as accurate by ARMLS
All information should be verified by the recipient and none is guaranteed as accurate by ARMLS
Listing Information presented by local MLS brokerage: Ten-X, local REALTOR®- Arlene Richardson - (888)-952-6393
- 1024 Painted Cloud Place
- 974 Painted Cloud Place
- 467 E Summer Storm Ln
- 505 E Ruby Place
- 498 E Todd Place
- 344 E Altozano Rd
- 344 E Altozano Rd Unit 126
- 843 N Madison Heights
- 238 E Altozano Rd
- 238 E Altozano Rd Unit 120
- 258 E Loma Rd
- 258 E Loma Rd Unit 130
- 0 Solente Phase 1b Unit 25-265138
- 0 Solente Phase 1b Lot 138 Unit 113239
- Lot 116 Solente
- 92 Colima Rd
- 318 E Otero Rd
- 318 E Otero Rd Unit 147
- 151 Colima Rd
- Lot 105 Solente