1063 E 34 St Brooklyn, NY 11210
Flatlands NeighborhoodEstimated Value: $884,000 - $1,155,000
5
Beds
2
Baths
1,778
Sq Ft
$552/Sq Ft
Est. Value
About This Home
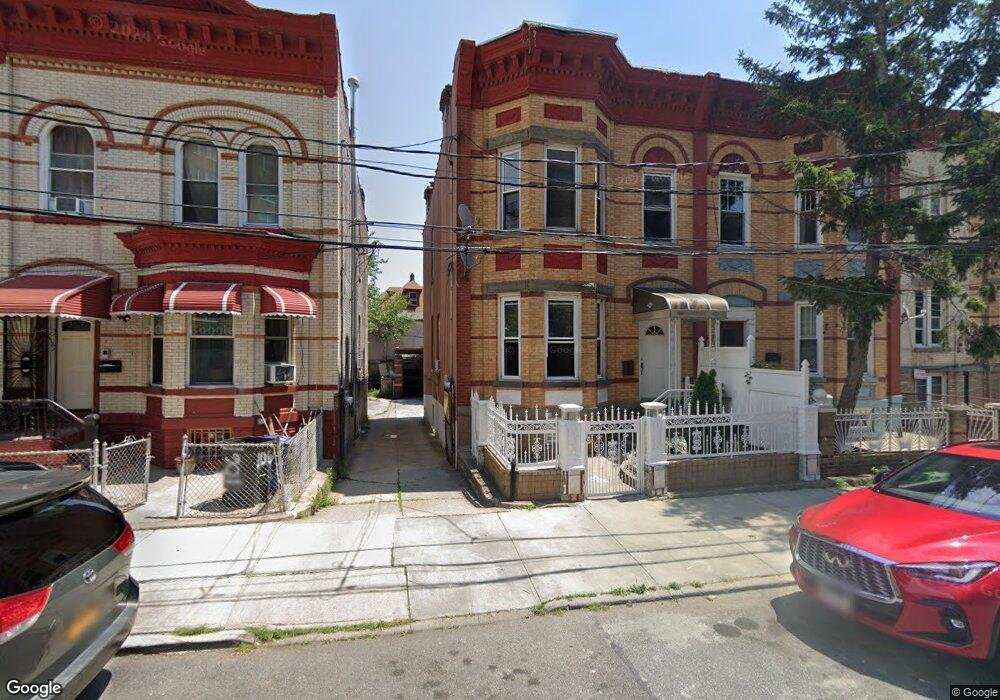
This home is located at 1063 E 34 St, Brooklyn, NY 11210 and is currently estimated at $981,436, approximately $551 per square foot. 1063 E 34 St is a home located in Kings County with nearby schools including P.S. 109, Andries Hudde School, and Mesivta Tiferes Yisroel.
Ownership History
Date
Name
Owned For
Owner Type
Purchase Details
Closed on
Feb 22, 2022
Sold by
Solon Gerda and Solon Yonel
Bought by
Hewitt Abigail and Walker Ricardo
Current Estimated Value
Home Financials for this Owner
Home Financials are based on the most recent Mortgage that was taken out on this home.
Original Mortgage
$844,423
Outstanding Balance
$785,429
Interest Rate
3.69%
Mortgage Type
Purchase Money Mortgage
Estimated Equity
$196,007
Purchase Details
Closed on
Dec 5, 2000
Sold by
Best Express Homes Inc
Bought by
Solon Gerda and Solon Yonel
Home Financials for this Owner
Home Financials are based on the most recent Mortgage that was taken out on this home.
Original Mortgage
$286,600
Interest Rate
7.14%
Mortgage Type
FHA
Purchase Details
Closed on
Aug 8, 2000
Sold by
Ross Sidney F M
Bought by
Best Express Homes Inc
Create a Home Valuation Report for This Property
The Home Valuation Report is an in-depth analysis detailing your home's value as well as a comparison with similar homes in the area
Home Values in the Area
Average Home Value in this Area
Purchase History
| Date | Buyer | Sale Price | Title Company |
|---|---|---|---|
| Hewitt Abigail | $860,000 | -- | |
| Solon Gerda | $289,000 | -- | |
| Best Express Homes Inc | $175,000 | -- |
Source: Public Records
Mortgage History
| Date | Status | Borrower | Loan Amount |
|---|---|---|---|
| Open | Hewitt Abigail | $844,423 | |
| Previous Owner | Solon Gerda | $286,600 |
Source: Public Records
Tax History
| Year | Tax Paid | Tax Assessment Tax Assessment Total Assessment is a certain percentage of the fair market value that is determined by local assessors to be the total taxable value of land and additions on the property. | Land | Improvement |
|---|---|---|---|---|
| 2025 | $7,546 | $56,760 | $14,760 | $42,000 |
| 2024 | $7,546 | $49,920 | $14,760 | $35,160 |
| 2023 | $7,199 | $53,340 | $14,760 | $38,580 |
| 2022 | $6,676 | $52,320 | $14,760 | $37,560 |
| 2021 | $6,580 | $41,040 | $14,760 | $26,280 |
| 2019 | $6,257 | $40,620 | $14,760 | $25,860 |
| 2018 | $5,724 | $29,539 | $10,733 | $18,806 |
| 2017 | $5,381 | $27,867 | $10,498 | $17,369 |
| 2016 | $5,133 | $27,228 | $12,290 | $14,938 |
| 2015 | $2,951 | $26,100 | $9,571 | $16,529 |
| 2014 | $2,951 | $26,092 | $11,478 | $14,614 |
Source: Public Records
Map
Nearby Homes
- 1655 Flatbush Ave Unit A1004
- 1655 Flatbush Ave Unit B1809
- 1655 Flatbush Ave Unit A602
- 1655 Flatbush Ave Unit B1802
- 1655 Flatbush Ave Unit A1806
- 1655 Flatbush Ave Unit C202
- 1655 Flatbush Ave Unit A903
- 1655 Flatbush Ave Unit A1401
- 3517 Avenue I
- 3523 Avenue I
- 3510 Avenue H Unit 3 H
- 3320 Avenue H Unit 6P
- 1533 - 1535 New York Ave
- 1810 Avenue N Unit 4C
- 1810 Avenue N Unit 2F
- 1708 Flatbush Ave
- 927 E 35th St
- 3220 Avenue H Unit 4L
- 3220 Avenue H Unit 1J
- 3220 Avenue H Unit 6N
- 1065 E 34 St
- 1063 E 34th St
- 1065 E 34th St
- 1061 E 34 St
- 1061 E 34th St
- 1069 E 34th St
- 1059 E 34th St
- 1071 E 34th St
- 1057 E 34th St
- 1073 E 34th St
- 1055 E 34th St
- 1075 E 34th St
- 1655 Flatbush Ave
- 1655 Flatbush Ave Unit A 103
- 1655 Flatbush Ave
- 1655 Flatbush Ave Unit A-702
- 1655 Flatbush Ave Unit C145
- 1655 Flatbush Ave Unit C610
- 1655 Flatbush Ave Unit B802
- 1655 Flatbush Ave Unit C705
Your Personal Tour Guide
Ask me questions while you tour the home.