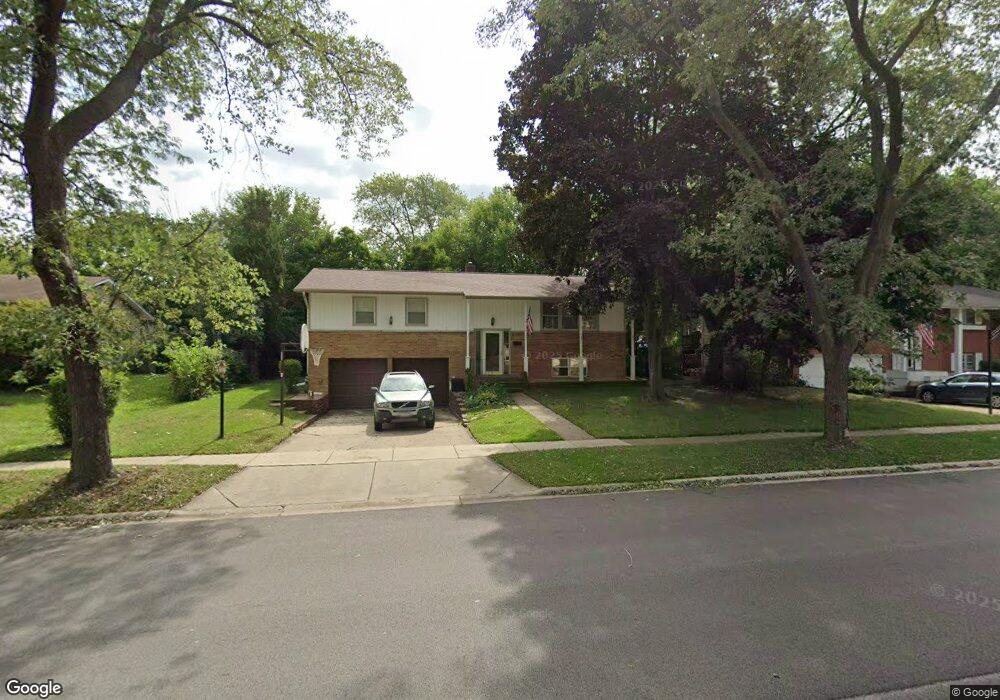
1063 E Williams Dr Palatine, IL 60074
Winston Park NeighborhoodEstimated Value: $311,000 - $461,000
4
Beds
2
Baths
1,248
Sq Ft
$315/Sq Ft
Est. Value
About This Home
This home is located at 1063 E Williams Dr, Palatine, IL 60074 and is currently estimated at $392,961, approximately $314 per square foot. 1063 E Williams Dr is a home located in Cook County with nearby schools including Jane Addams Elementary School, Palatine High School, and St Thomas Of Villanova School.
Ownership History
Date
Name
Owned For
Owner Type
Purchase Details
Closed on
May 13, 2019
Sold by
Migacz Ewa
Bought by
Migacz Leszek
Current Estimated Value
Purchase Details
Closed on
May 1, 2017
Sold by
Migacz Leszek
Bought by
Migacz Leszek and Migacz Ewa
Purchase Details
Closed on
Mar 26, 2004
Sold by
Lapinska Migacz Hanna and Migacz Lisec
Bought by
Lapinska Migacz Hanna and Migacz Leszek
Home Financials for this Owner
Home Financials are based on the most recent Mortgage that was taken out on this home.
Original Mortgage
$144,500
Interest Rate
5.65%
Mortgage Type
New Conventional
Purchase Details
Closed on
Oct 15, 1997
Sold by
Wank John H and Kennedy Arthur
Bought by
Migacz Leszek and Migacz Hanna
Home Financials for this Owner
Home Financials are based on the most recent Mortgage that was taken out on this home.
Original Mortgage
$125,100
Interest Rate
7.12%
Create a Home Valuation Report for This Property
The Home Valuation Report is an in-depth analysis detailing your home's value as well as a comparison with similar homes in the area
Home Values in the Area
Average Home Value in this Area
Purchase History
| Date | Buyer | Sale Price | Title Company |
|---|---|---|---|
| Migacz Leszek | -- | Attorney | |
| Migacz Leszek | -- | None Available | |
| Lapinska Migacz Hanna | -- | Lawyers Title Ins | |
| Migacz Leszek | $139,000 | -- |
Source: Public Records
Mortgage History
| Date | Status | Borrower | Loan Amount |
|---|---|---|---|
| Closed | Lapinska Migacz Hanna | $144,500 | |
| Closed | Migacz Leszek | $125,100 |
Source: Public Records
Tax History
| Year | Tax Paid | Tax Assessment Tax Assessment Total Assessment is a certain percentage of the fair market value that is determined by local assessors to be the total taxable value of land and additions on the property. | Land | Improvement |
|---|---|---|---|---|
| 2025 | $7,604 | $38,000 | $8,287 | $29,713 |
| 2024 | $7,604 | $29,000 | $6,978 | $22,022 |
| 2023 | $7,326 | $29,000 | $6,978 | $22,022 |
| 2022 | $7,326 | $29,000 | $6,978 | $22,022 |
| 2021 | $7,097 | $25,182 | $4,361 | $20,821 |
| 2020 | $7,064 | $25,182 | $4,361 | $20,821 |
| 2019 | $7,086 | $28,137 | $4,361 | $23,776 |
| 2018 | $6,231 | $23,486 | $3,925 | $19,561 |
| 2017 | $6,132 | $23,486 | $3,925 | $19,561 |
| 2016 | $6,332 | $24,830 | $3,925 | $20,905 |
| 2015 | $5,683 | $21,121 | $3,489 | $17,632 |
| 2014 | $5,631 | $21,121 | $3,489 | $17,632 |
| 2013 | $5,469 | $21,121 | $3,489 | $17,632 |
Source: Public Records
Map
Nearby Homes
- 27 S Stonington Dr Unit 172
- 14 S Stonington Dr Unit 32
- 45 S Stonington Dr Unit 4
- 353 N Clark Dr
- 126 N Rohlwing Rd
- 909 E Kenilworth Ave Unit 321
- 909 E Kenilworth Ave Unit 420
- 648 E Lincoln St
- 714 E Eisenhower Ave
- 263 S Clubhouse Dr Unit 205
- 263 S Clubhouse Dr Unit 304
- 245 S Park Ln Unit 321
- 649 E Eisenhower Ave
- 40 S Arlene Ave
- 900 E Wilmette Rd Unit 218
- 950 E Wilmette Rd Unit 414
- 114 S Arlene Ave Unit 6
- 1117 E Pratt Dr
- 855 E Patten Dr
- 651 N Williams Dr
- 1055 E Williams Dr
- 1103 E Williams Dr
- 1100 E Fosket Dr
- 1058 E Fosket Dr
- 1110 E Fosket Dr
- 1047 E Williams Dr
- 1062 E Williams Dr
- 1113 E Williams Dr
- 1052 E Fosket Dr
- 1054 E Williams Dr
- 106 N Fosket Dr
- 1104 E Williams Dr
- 1046 E Williams Dr Unit 2
- 1037 E Williams Dr
- 1044 E Fosket Dr
- 1114 E Williams Dr
- 1101 E Fosket Dr
- 1053 E Flake Dr
- 1059 E Fosket Dr
- 1043 E Williams Dr
Your Personal Tour Guide
Ask me questions while you tour the home.