
Seller's Agent in 2019
Martin Lovelace
Benchmark Realty, LLC
(615) 618-7232
57 Total Sales

Please note, our homes are available on a first-come, first-serve basis and are not reserved until the holding fee agreement is signed and the holding fee is paid by the primary applicant.
This home features Progress Smart Home - Progress Residential's smart home app, which allows you to control the home securely from any of your devices. Learn more at
This home is priced to rent and won't be around for long. Apply now, while we make this home ready for you, or call to arrange a meeting with your local Progress Residential leasing specialist today.
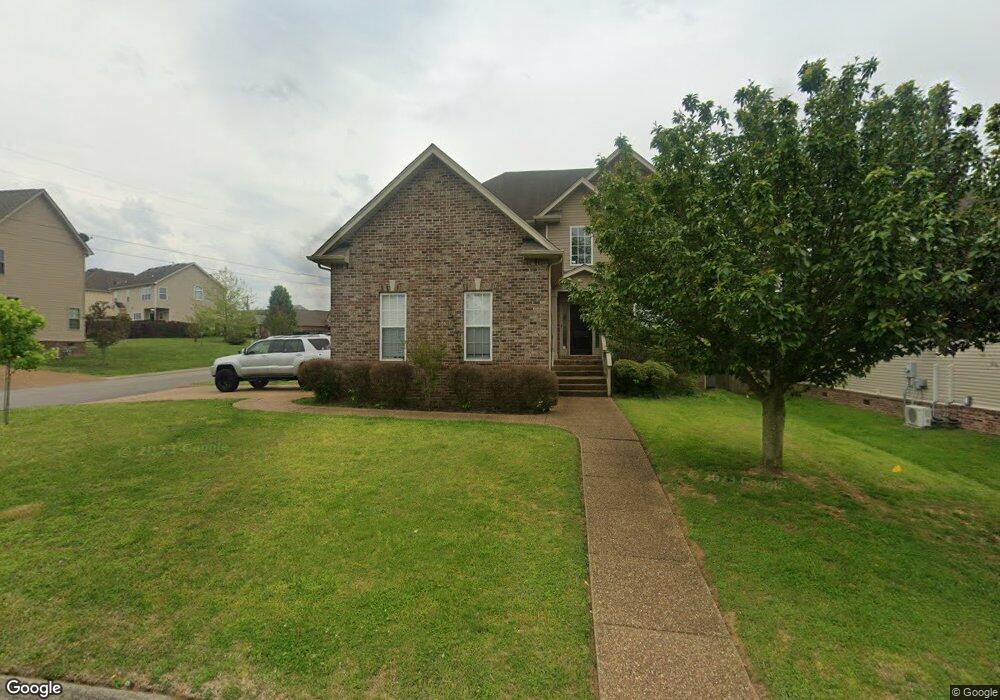
With an attractive brick exterior and an attached two-car garage, this pet-friendly, three-bedroom, two-and-one-half-bathroom rental home in Spring Hill, TN has plenty to offer. An entry foyer leads to a spacious living room with a gorgeous fireplace, a convenient ceiling fan, and new wood-look vinyl plank floors. The kitchen boasts plenty of upgrades and comes with granite countertops, a tile backsplash, and full-sized appliances. Upstairs, the master bedroom is spacious with lots of big windows. There's also a walk-in closet and an en suite master bathroom included in the master suite. Outside, you'll find a large, grassy fenced-in yard and wooden deck. To see this Spring Hill rental home in-person, schedule your personal tour today.
Last Agent to Sell the Property
Benchmark Realty, LLC Brokerage Phone: 6156187232 License # 324193 Listed on: 10/18/2019
We collect this data history from publicly available records. To have your information removed, we recommend requesting removal directly through your county’s website.
| Date | Event | Price | List to Sale | Price per Sq Ft |
|---|---|---|---|---|
| 04/27/2025 04/27/25 | Off Market | $2,385 | -- | -- |
| 04/18/2025 04/18/25 | Price Changed | $2,385 | +0.2% | $1 / Sq Ft |
| 04/14/2025 04/14/25 | Price Changed | $2,380 | -0.2% | $1 / Sq Ft |
| 04/13/2025 04/13/25 | Price Changed | $2,385 | +3.2% | $1 / Sq Ft |
| 04/08/2025 04/08/25 | Price Changed | $2,310 | -1.5% | $1 / Sq Ft |
| 04/07/2025 04/07/25 | Price Changed | $2,345 | -0.2% | $1 / Sq Ft |
| 04/03/2025 04/03/25 | Price Changed | $2,350 | +0.4% | $1 / Sq Ft |
| 04/02/2025 04/02/25 | Price Changed | $2,340 | -1.9% | $1 / Sq Ft |
| 04/01/2025 04/01/25 | Price Changed | $2,385 | +0.2% | $1 / Sq Ft |
| 03/31/2025 03/31/25 | Price Changed | $2,380 | +0.2% | $1 / Sq Ft |
| 03/30/2025 03/30/25 | Price Changed | $2,375 | +0.2% | $1 / Sq Ft |
| 03/28/2025 03/28/25 | Price Changed | $2,370 | -1.7% | $1 / Sq Ft |
| 03/26/2025 03/26/25 | Price Changed | $2,410 | +0.2% | $1 / Sq Ft |
| 03/24/2025 03/24/25 | Price Changed | $2,405 | +0.2% | $1 / Sq Ft |
| 03/23/2025 03/23/25 | Price Changed | $2,400 | +0.2% | $1 / Sq Ft |
| 03/17/2025 03/17/25 | Price Changed | $2,395 | +0.2% | $1 / Sq Ft |
| 03/12/2025 03/12/25 | Price Changed | $2,390 | -1.8% | $1 / Sq Ft |
| 03/06/2025 03/06/25 | Price Changed | $2,435 | -1.6% | $1 / Sq Ft |
| 03/02/2025 03/02/25 | Price Changed | $2,475 | +0.2% | $1 / Sq Ft |
| 03/01/2025 03/01/25 | Price Changed | $2,470 | +0.2% | $1 / Sq Ft |
| 03/01/2025 03/01/25 | For Rent | $2,465 | 0.0% | -- |
| 11/29/2019 11/29/19 | Sold | $250,000 | -9.1% | $117 / Sq Ft |
| 10/18/2019 10/18/19 | Pending | -- | -- | -- |
| 10/18/2019 10/18/19 | For Sale | $274,900 | -- | $128 / Sq Ft |
We collect this data history from publicly available records. To have your information removed, we recommend requesting removal directly through your county’s website.
| Year | Tax Paid | Tax Assessment Tax Assessment Total Assessment is a certain percentage of the fair market value that is determined by local assessors to be the total taxable value of land and additions on the property. | Land | Improvement |
|---|---|---|---|---|
| 2025 | $1,496 | $101,150 | $20,000 | $81,150 |
| 2024 | $1,496 | $101,150 | $20,000 | $81,150 |
| 2023 | $3,864 | $101,150 | $20,000 | $81,150 |
| 2022 | $2,680 | $101,150 | $20,000 | $81,150 |
| 2021 | $2,680 | $59,025 | $8,750 | $50,275 |
| 2020 | $1,887 | $59,025 | $8,750 | $50,275 |
| 2019 | $1,016 | $59,025 | $8,750 | $50,275 |
| 2018 | $354 | $59,025 | $8,750 | $50,275 |
| 2017 | $1,614 | $47,350 | $8,750 | $38,600 |
| 2016 | $1,614 | $47,350 | $8,750 | $38,600 |
| 2015 | $1,514 | $47,350 | $8,750 | $38,600 |
| 2014 | $1,514 | $47,350 | $8,750 | $38,600 |
Seller's Agent in 2019
Martin Lovelace
Benchmark Realty, LLC
(615) 618-7232
57 Total Sales
Buyer's Agent in 2019
Erin Krueger
Compass Tennessee, LLC
(615) 509-7166
651 Total Sales
Source: Realtracs
MLS Number: RTC2092293
APN: 060050C A 01800
Disclaimer: Certain information contained herein is derived from information provided by parties other than Homes.com. All information provided is deemed reliable, but is not guaranteed to be accurate and should be independently verified.
![]() All data is obtained from various sources and may not have been verified by broker or MLS GRID. Supplied Open House Information is subject to change without notice. All information should be independently reviewed and verified for accuracy. Properties may or may not be listed by the office/agent presenting the information. Some IDX listings have been excluded from this website.
All data is obtained from various sources and may not have been verified by broker or MLS GRID. Supplied Open House Information is subject to change without notice. All information should be independently reviewed and verified for accuracy. Properties may or may not be listed by the office/agent presenting the information. Some IDX listings have been excluded from this website.
Listings courtesy of Realtracs as distributed by MLS GRID.
Based on information submitted to the MLS GRID
Ask me questions while you tour the home.