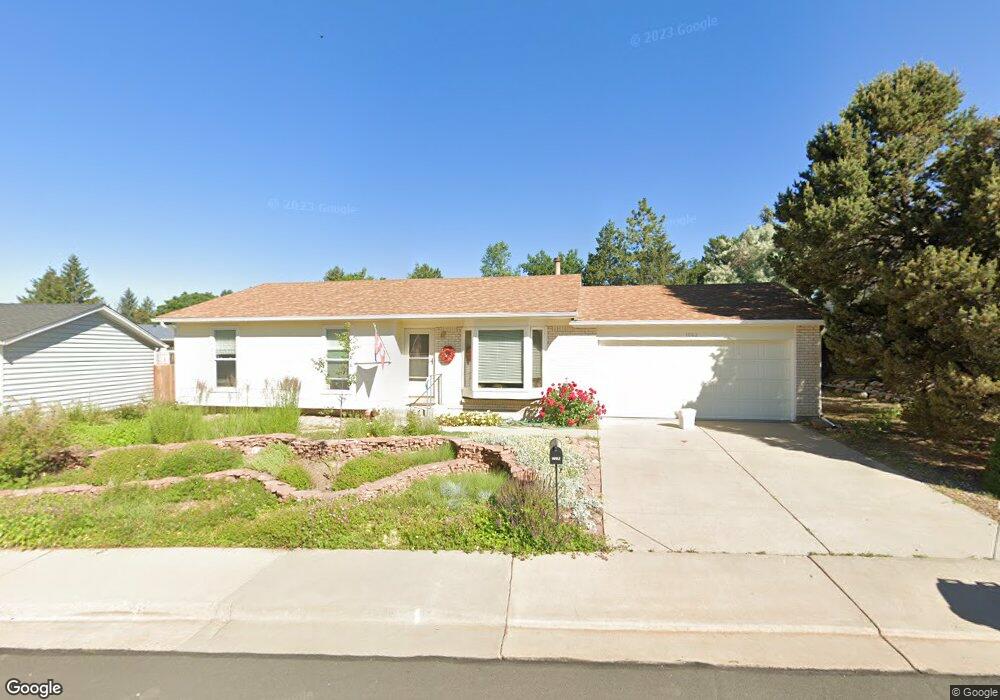
1063 Lilac Ct Broomfield, CO 80020
Lac Amora NeighborhoodEstimated Value: $543,000 - $597,000
5
Beds
2
Baths
2,234
Sq Ft
$254/Sq Ft
Est. Value
About This Home
This home is located at 1063 Lilac Ct, Broomfield, CO 80020 and is currently estimated at $566,574, approximately $253 per square foot. 1063 Lilac Ct is a home located in Broomfield County with nearby schools including Aspen Creek K-8 School, Broomfield High School, and Jefferson Academy Secondary School.
Ownership History
Date
Name
Owned For
Owner Type
Purchase Details
Closed on
Jun 29, 2009
Sold by
Grieve Daniel H and Verbeke Agniya
Bought by
Wood Robert D
Current Estimated Value
Home Financials for this Owner
Home Financials are based on the most recent Mortgage that was taken out on this home.
Original Mortgage
$165,000
Outstanding Balance
$105,088
Interest Rate
4.84%
Mortgage Type
Purchase Money Mortgage
Estimated Equity
$461,486
Purchase Details
Closed on
May 29, 2002
Sold by
Jones Michelle E
Bought by
Grieve Daniel H and Verbeke Agniya
Home Financials for this Owner
Home Financials are based on the most recent Mortgage that was taken out on this home.
Original Mortgage
$203,130
Interest Rate
6.77%
Mortgage Type
FHA
Purchase Details
Closed on
Nov 26, 1997
Purchase Details
Closed on
Aug 24, 1987
Purchase Details
Closed on
Oct 12, 1977
Create a Home Valuation Report for This Property
The Home Valuation Report is an in-depth analysis detailing your home's value as well as a comparison with similar homes in the area
Home Values in the Area
Average Home Value in this Area
Purchase History
| Date | Buyer | Sale Price | Title Company |
|---|---|---|---|
| Wood Robert D | $235,000 | Chicago Title Co | |
| Grieve Daniel H | $206,000 | Title America | |
| -- | $123,600 | -- | |
| -- | $77,000 | -- | |
| -- | $40,800 | -- |
Source: Public Records
Mortgage History
| Date | Status | Borrower | Loan Amount |
|---|---|---|---|
| Open | Wood Robert D | $165,000 | |
| Previous Owner | Grieve Daniel H | $203,130 |
Source: Public Records
Tax History Compared to Growth
Tax History
| Year | Tax Paid | Tax Assessment Tax Assessment Total Assessment is a certain percentage of the fair market value that is determined by local assessors to be the total taxable value of land and additions on the property. | Land | Improvement |
|---|---|---|---|---|
| 2025 | $3,238 | $35,120 | $9,050 | $26,070 |
| 2024 | $3,238 | $34,560 | $8,170 | $26,390 |
| 2023 | $3,232 | $39,670 | $9,380 | $30,290 |
| 2022 | $2,778 | $28,740 | $6,600 | $22,140 |
| 2021 | $2,764 | $29,560 | $6,790 | $22,770 |
| 2020 | $2,559 | $27,200 | $6,440 | $20,760 |
| 2019 | $2,554 | $27,380 | $6,480 | $20,900 |
| 2018 | $2,131 | $22,580 | $4,570 | $18,010 |
| 2017 | $2,099 | $24,960 | $5,050 | $19,910 |
| 2016 | $1,821 | $19,310 | $5,050 | $14,260 |
| 2015 | $1,758 | $16,580 | $5,050 | $11,530 |
| 2014 | $1,543 | $16,580 | $5,050 | $11,530 |
Source: Public Records
Map
Nearby Homes
- 1043 Lilac Ct
- 1087 Lilac St
- 880 Lilac St
- 3132 W 10th Avenue Place
- 1179 Lilac St
- 2150 Ridge Dr
- 2340 Rim Dr
- 2191 Ridge Dr
- 639 Quartz Way
- 1740 W 6th Ave
- 1010 Opal St Unit 102
- 1148 Opal St Unit 101
- 1320 W 12th Ave
- 1176 Opal St Unit 104
- 1176 Opal St Unit 102
- 1196 Opal St Unit 201
- 1190 W 11th Ct
- 680 Kalmia Way
- 640 Kalmia Way
- 1035 Iris St
- 1083 Lilac Ct
- 2986 W 10th Avenue Cir
- 2976 W 10th Avenue Cir
- 1044 Maple Dr
- 1023 Lilac Ct
- 1042 Lilac Ct
- 2996 W 10th Avenue Cir
- 1093 Lilac Ct
- 1022 Lilac Ct
- 1024 Maple Dr
- 2956 W 10th Avenue Cir
- 1003 Lilac Ct
- 1002 Lilac Ct
- 1082 Lilac Ct
- 1052 Lilac Ct
- 1097 Lilac Cir
- 1004 Maple Dr
- 1029 Lilac St
- 1099 Lilac Cir
- 3006 W 10th Avenue Cir