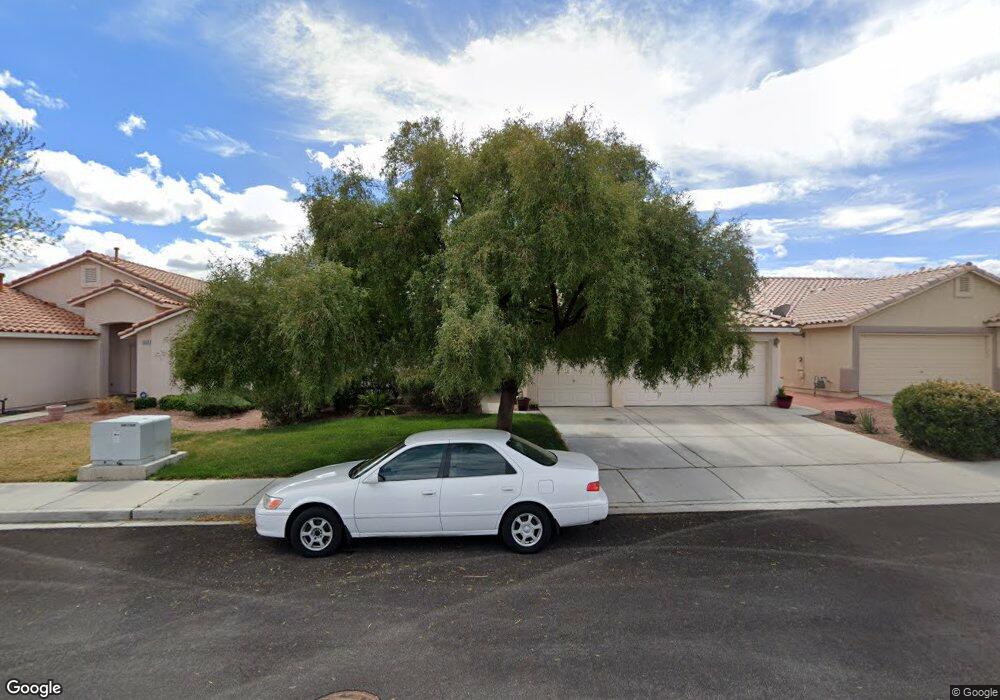
1063 Oak Shade Ln Henderson, NV 89015
River Mountain NeighborhoodEstimated Value: $436,000 - $445,000
3
Beds
2
Baths
1,592
Sq Ft
$276/Sq Ft
Est. Value
About This Home
This home is located at 1063 Oak Shade Ln, Henderson, NV 89015 and is currently estimated at $438,977, approximately $275 per square foot. 1063 Oak Shade Ln is a home located in Clark County with nearby schools including Sue H. Morrow Elementary School, B Mahlon Brown Academy of International Studies, and Basic Academy of International Studies.
Ownership History
Date
Name
Owned For
Owner Type
Purchase Details
Closed on
Jul 14, 2025
Sold by
Salmon Ronald Ray and Leavitt-Salmon Elizabeth Ann
Bought by
Ronald Ray Salmon And Elizabeth Ann Leavitt-S
Current Estimated Value
Purchase Details
Closed on
Mar 26, 2009
Sold by
Salmon Ronald R
Bought by
Salmon Ronald R and Salmon Elizabeth Ann
Home Financials for this Owner
Home Financials are based on the most recent Mortgage that was taken out on this home.
Original Mortgage
$143,000
Interest Rate
5.15%
Mortgage Type
New Conventional
Purchase Details
Closed on
Mar 28, 2008
Sold by
Salmon Ronald R and Salmon Lyle J
Bought by
Salmon Ronald R
Purchase Details
Closed on
May 4, 2000
Sold by
D R Horton Inc
Bought by
Salmon Ronald R and Salmon Lyle J
Home Financials for this Owner
Home Financials are based on the most recent Mortgage that was taken out on this home.
Original Mortgage
$111,600
Interest Rate
8.22%
Create a Home Valuation Report for This Property
The Home Valuation Report is an in-depth analysis detailing your home's value as well as a comparison with similar homes in the area
Home Values in the Area
Average Home Value in this Area
Purchase History
| Date | Buyer | Sale Price | Title Company |
|---|---|---|---|
| Ronald Ray Salmon And Elizabeth Ann Leavitt-S | -- | None Listed On Document | |
| Salmon Ronald R | -- | Ticor Title Las Vegas | |
| Salmon Ronald R | -- | None Available | |
| Salmon Ronald R | $139,516 | Old Republic Title Company |
Source: Public Records
Mortgage History
| Date | Status | Borrower | Loan Amount |
|---|---|---|---|
| Previous Owner | Salmon Ronald R | $143,000 | |
| Previous Owner | Salmon Ronald R | $111,600 |
Source: Public Records
Tax History Compared to Growth
Tax History
| Year | Tax Paid | Tax Assessment Tax Assessment Total Assessment is a certain percentage of the fair market value that is determined by local assessors to be the total taxable value of land and additions on the property. | Land | Improvement |
|---|---|---|---|---|
| 2025 | $1,806 | $95,341 | $30,100 | $65,241 |
| 2024 | $1,754 | $95,341 | $30,100 | $65,241 |
| 2023 | $1,342 | $97,251 | $35,350 | $61,901 |
| 2022 | $1,703 | $87,017 | $30,450 | $56,567 |
| 2021 | $1,729 | $80,043 | $26,250 | $53,793 |
| 2020 | $1,602 | $77,914 | $24,500 | $53,414 |
| 2019 | $1,502 | $74,613 | $22,050 | $52,563 |
| 2018 | $1,433 | $68,149 | $17,500 | $50,649 |
| 2017 | $1,964 | $67,766 | $16,450 | $51,316 |
| 2016 | $1,342 | $61,142 | $9,800 | $51,342 |
| 2015 | $1,339 | $48,827 | $9,800 | $39,027 |
| 2014 | $1,299 | $44,680 | $8,400 | $36,280 |
Source: Public Records
Map
Nearby Homes
- 717 Triple Crown St
- 1041 Kennebunk Cir
- 1044 Kennebunk Cir
- 1077 Nordyke Ave
- 730 Booted Eagle St
- 1024 Greyhound Ln
- 620 Camp Hill Rd
- 1126 Langston Ranch Ave
- 1038 Beaver Crest Terrace
- 732 Goshawk St
- 719 Tawney Eagle St
- 1082 Langston Ranch Ave
- 731 Tawney Eagle St
- 1001 Benton Ave
- 1008 Beaver Crest Terrace
- 623 Braverwood Dr
- 698 S Racetrack Rd Unit 724
- 698 S Racetrack Rd Unit 1411
- 698 S Racetrack Rd Unit 1521
- 698 S Racetrack Rd Unit 1621
- 1061 Oak Shade Ln
- 1065 Oak Shade Ln
- 1059 Oak Shade Ln
- 1059 Oak Shade Ln Unit 1059
- 1059 Oak Shade Ln Unit No
- 1067 Oak Shade Ln
- 641 Dan St
- 1066 Oak Shade Ln
- 1057 Oak Shade Ln
- 1069 Oak Shade Ln
- 1120 Sport of Kings Ave
- 1118 Sport of Kings Ave
- 1068 Oak Shade Ln
- 1122 Sport of Kings Ave
- 1116 Sport of Kings Ave
- 639 Dan St
- 1090 Blue Lantern Dr
- 1124 Sport of Kings Ave
- 1114 Sport of Kings Ave
- 1071 Oak Shade Ln