1063 Railroad Dr Montgomery, MI 49255
Estimated Value: $63,000 - $168,000
5
Beds
1
Bath
2,471
Sq Ft
$56/Sq Ft
Est. Value
About This Home
This home is located at 1063 Railroad Dr, Montgomery, MI 49255 and is currently estimated at $138,864, approximately $56 per square foot. 1063 Railroad Dr is a home located in Branch County with nearby schools including Jennings Elementary School, Quincy Middle School, and Quincy High School.
Ownership History
Date
Name
Owned For
Owner Type
Purchase Details
Closed on
Feb 3, 2023
Sold by
Carpenter Norman Duane and Carpenter Scott
Bought by
Hazekamp Nathaniel Jacob
Current Estimated Value
Purchase Details
Closed on
Mar 25, 2008
Sold by
The Huntington National Bank
Bought by
Self Help Venture Funds
Purchase Details
Closed on
Jan 31, 2008
Sold by
Shaw Adam M and Dirschell Joshua L
Bought by
The Huntington National Bank
Purchase Details
Closed on
Oct 15, 2004
Sold by
Carpenter Betty L and Bradley Franklin R
Bought by
Shaw Adam M and Dirschell Joshua L
Home Financials for this Owner
Home Financials are based on the most recent Mortgage that was taken out on this home.
Original Mortgage
$85,000
Interest Rate
5.93%
Mortgage Type
Purchase Money Mortgage
Purchase Details
Closed on
Nov 1, 1999
Sold by
Bradley Nancy Surv Preston
Bought by
Bradley Nancy
Create a Home Valuation Report for This Property
The Home Valuation Report is an in-depth analysis detailing your home's value as well as a comparison with similar homes in the area
Home Values in the Area
Average Home Value in this Area
Purchase History
| Date | Buyer | Sale Price | Title Company |
|---|---|---|---|
| Hazekamp Nathaniel Jacob | $30,000 | None Listed On Document | |
| Self Help Venture Funds | -- | None Available | |
| The Huntington National Bank | $85,706 | None Available | |
| Shaw Adam M | $85,000 | Branch County Abstract & Tit | |
| Bradley Nancy | -- | -- | |
| Bradley Nancy M | -- | -- |
Source: Public Records
Mortgage History
| Date | Status | Borrower | Loan Amount |
|---|---|---|---|
| Previous Owner | Shaw Adam M | $85,000 |
Source: Public Records
Tax History Compared to Growth
Tax History
| Year | Tax Paid | Tax Assessment Tax Assessment Total Assessment is a certain percentage of the fair market value that is determined by local assessors to be the total taxable value of land and additions on the property. | Land | Improvement |
|---|---|---|---|---|
| 2025 | $2,736 | $60,935 | $0 | $0 |
| 2024 | $218 | $58,826 | $0 | $0 |
| 2023 | $218 | $50,176 | $0 | $0 |
| 2022 | $218 | $47,962 | $0 | $0 |
| 2021 | -- | $44,386 | $0 | $0 |
| 2020 | -- | $42,181 | $0 | $0 |
| 2019 | -- | $41,678 | $0 | $0 |
| 2018 | -- | $39,337 | $0 | $0 |
| 2017 | -- | $30,085 | $0 | $0 |
| 2016 | -- | $29,547 | $0 | $0 |
| 2015 | -- | $22,470 | $0 | $0 |
| 2014 | -- | $20,412 | $0 | $0 |
| 2013 | -- | $20,203 | $0 | $0 |
Source: Public Records
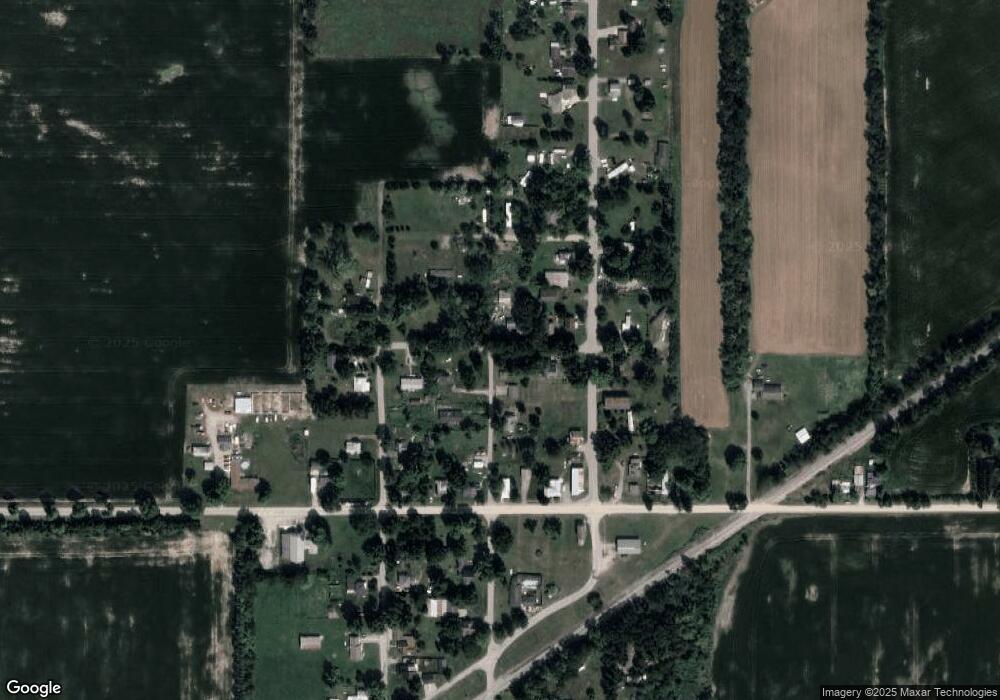
Map
Nearby Homes
- 6430 E 784 N
- V/L Delmar Rd
- 120 Sunset Bay Ct
- 1004 E Copeland Rd
- 8860 E 710 N Clear Lake Estates
- 380 Schaeffer Ct Fish Lake
- 6780 E 500 N
- 5050 N 725 E
- 3217 E 700 N
- 12208 Maple St
- TBD Evans Dr
- 115 N Michigan St
- 9911 Lake Dr
- 406 Prairie Ln
- 105 N Mill St
- 202 E Toledo St
- 304 Hardy St
- 200 Michael St
- 9677 W Camden Rd
- 6405 N 300 E
- 1062 Railroad Dr
- 1050 Delmar Rd
- 1039 Main Dr
- 1051 Delmar Rd
- 1058 Delmar Rd
- 1055 Delmar Rd
- 0 S Main St
- 1060 Railroad Dr
- 1060 Railroad Dr
- 1057 Railroad Dr
- 1049 Delmar Rd
- 1046 Delmar Rd
- 1 Main St
- 1057 Delmar Rd
- 1073 Railroad Dr
- 1066 State Line Rd
- 1064 State Line Rd
- 1062 State Line Rd
- 1072 Railroad Dr
- 1060 State Line Rd