Estimated Value: $539,000 - $630,000
3
Beds
2
Baths
2,010
Sq Ft
$288/Sq Ft
Est. Value
About This Home
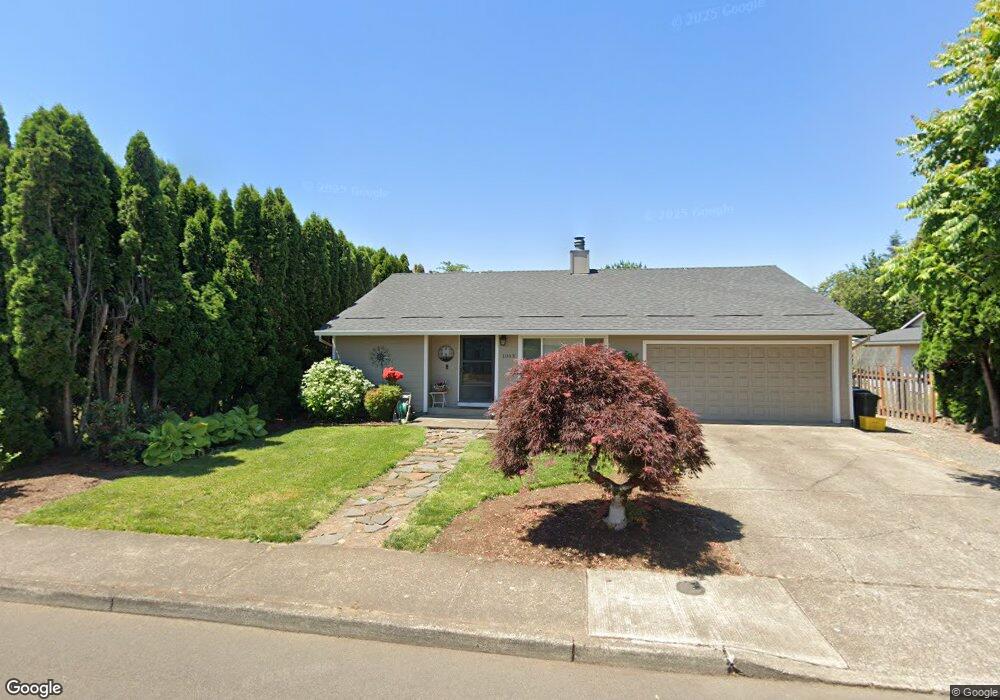
This home is located at 1063 S Fir St, Canby, OR 97013 and is currently estimated at $578,638, approximately $287 per square foot. 1063 S Fir St is a home located in Clackamas County with nearby schools including Josefa L. Sambrano Elementary School, Philander Lee Elementary School, and Baker Prairie Middle School.
Ownership History
Date
Name
Owned For
Owner Type
Purchase Details
Closed on
Sep 7, 2016
Sold by
Elder Jeff
Bought by
Hanno Jered and Hanno Karissa
Current Estimated Value
Home Financials for this Owner
Home Financials are based on the most recent Mortgage that was taken out on this home.
Original Mortgage
$277,600
Outstanding Balance
$221,278
Interest Rate
3.45%
Mortgage Type
New Conventional
Estimated Equity
$357,360
Purchase Details
Closed on
Jun 19, 2003
Sold by
Elder Trisha
Bought by
Elder Jeff
Purchase Details
Closed on
Jan 21, 2003
Sold by
Elder Joey
Bought by
Elder Trisha
Home Financials for this Owner
Home Financials are based on the most recent Mortgage that was taken out on this home.
Original Mortgage
$190,000
Interest Rate
5.25%
Purchase Details
Closed on
Jul 24, 1998
Sold by
Zagyva Michael A and Zagyva Marcia A
Bought by
Elder Joey and Elder Trisha
Home Financials for this Owner
Home Financials are based on the most recent Mortgage that was taken out on this home.
Original Mortgage
$136,000
Interest Rate
10%
Create a Home Valuation Report for This Property
The Home Valuation Report is an in-depth analysis detailing your home's value as well as a comparison with similar homes in the area
Home Values in the Area
Average Home Value in this Area
Purchase History
| Date | Buyer | Sale Price | Title Company |
|---|---|---|---|
| Hanno Jered | $347,000 | First American | |
| Elder Jeff | -- | Fidelity Natl Title Co Of Or | |
| Elder Trisha | -- | Transnation Title Insurance | |
| Elder Joey | $160,000 | Chicago Title Insurance Co |
Source: Public Records
Mortgage History
| Date | Status | Borrower | Loan Amount |
|---|---|---|---|
| Open | Hanno Jered | $277,600 | |
| Previous Owner | Elder Trisha | $190,000 | |
| Previous Owner | Elder Joey | $136,000 |
Source: Public Records
Tax History Compared to Growth
Tax History
| Year | Tax Paid | Tax Assessment Tax Assessment Total Assessment is a certain percentage of the fair market value that is determined by local assessors to be the total taxable value of land and additions on the property. | Land | Improvement |
|---|---|---|---|---|
| 2025 | $5,333 | $301,038 | -- | -- |
| 2024 | $5,184 | $292,270 | -- | -- |
| 2023 | $5,184 | $283,758 | $0 | $0 |
| 2022 | $4,768 | $275,494 | $0 | $0 |
| 2021 | $4,591 | $267,470 | $0 | $0 |
| 2020 | $4,509 | $259,680 | $0 | $0 |
| 2019 | $4,294 | $252,117 | $0 | $0 |
| 2018 | $4,198 | $244,774 | $0 | $0 |
| 2017 | $4,092 | $237,645 | $0 | $0 |
| 2016 | $3,955 | $230,723 | $0 | $0 |
| 2015 | $3,820 | $224,003 | $0 | $0 |
| 2014 | $3,710 | $217,479 | $0 | $0 |
Source: Public Records
Map
Nearby Homes
- 1491 S Fir St Unit 18
- 1487 S Fir St Unit Lot17
- 1485 S Fir St Unit Lot 16
- 1400 S Elm St Unit 91
- 476 SW 15th Ave
- 201 SE 16th Ave
- 442 SW 15th Ave Unit 15
- 448 SW 15th Ave Unit 14
- 452 SW 15th Ave Unit 13
- 481 S Holly St
- 299 SW 3rd Ave
- 574 S Ivy St
- 431 SW 3rd Ave
- 1339 S Baywood Ct
- 331 SE 9th Ave
- 363 SE 7th Ave
- 387 SE 7th Ave
- 248 SE Township Rd
- 224 SW 18th Ave
- 1655 S Elm St Unit 2