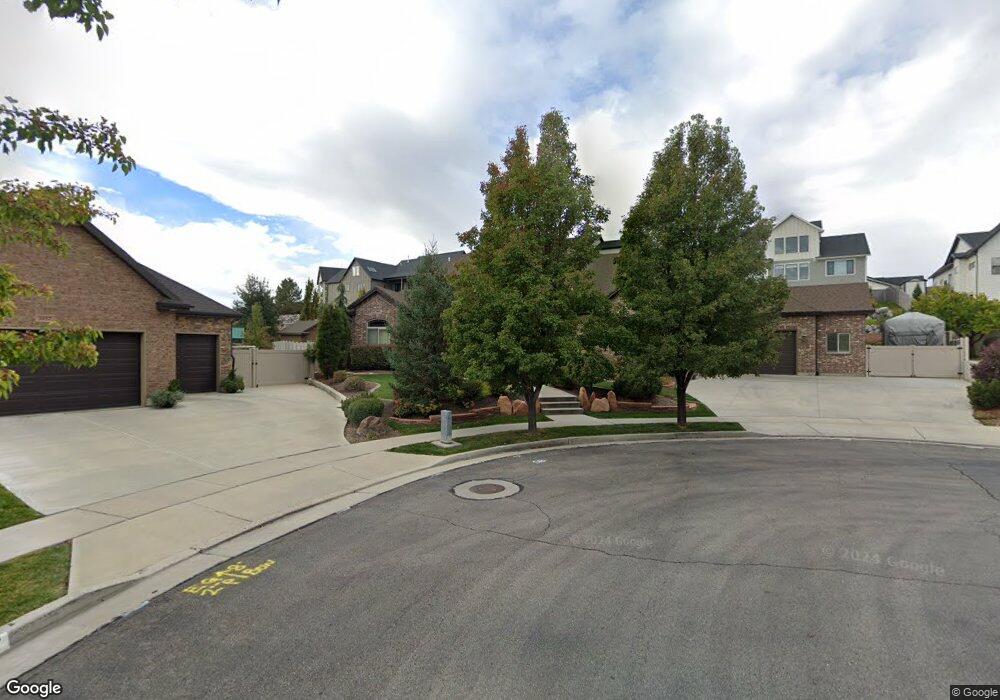
1063 W Albion View Cir Unit 35 West Jordan, UT 84088
Estimated Value: $1,042,000 - $1,376,894
2
Beds
3
Baths
3,922
Sq Ft
$302/Sq Ft
Est. Value
About This Home
This home is located at 1063 W Albion View Cir Unit 35, West Jordan, UT 84088 and is currently estimated at $1,184,474, approximately $302 per square foot. 1063 W Albion View Cir Unit 35 is a home located in Salt Lake County with nearby schools including Riverside Elementary School, West Jordan Middle School, and West Jordan High School.
Ownership History
Date
Name
Owned For
Owner Type
Purchase Details
Closed on
Sep 5, 2024
Sold by
Hopkins Jeff D and Hopkins Sherrie M
Bought by
Jeffrey Dale Hopkins And Sherrie M Hopkins Tr and Hopkins
Current Estimated Value
Purchase Details
Closed on
Aug 30, 2011
Sold by
Hopkins Jeffrey and Hopkins Sherri
Bought by
Hopkins Jeff D and Hopkins Sherrie M
Home Financials for this Owner
Home Financials are based on the most recent Mortgage that was taken out on this home.
Original Mortgage
$417,000
Interest Rate
4.46%
Mortgage Type
New Conventional
Purchase Details
Closed on
Aug 17, 2010
Sold by
River Oaks Estates Lc
Bought by
Hopkins Jeffrey and Hopkins Sherrie
Create a Home Valuation Report for This Property
The Home Valuation Report is an in-depth analysis detailing your home's value as well as a comparison with similar homes in the area
Home Values in the Area
Average Home Value in this Area
Purchase History
| Date | Buyer | Sale Price | Title Company |
|---|---|---|---|
| Jeffrey Dale Hopkins And Sherrie M Hopkins Tr | -- | -- | |
| Hopkins Jeff D | -- | Metro National Title | |
| Hopkins Jeffrey | -- | Utah Standard Title |
Source: Public Records
Mortgage History
| Date | Status | Borrower | Loan Amount |
|---|---|---|---|
| Previous Owner | Hopkins Jeff D | $417,000 |
Source: Public Records
Tax History Compared to Growth
Tax History
| Year | Tax Paid | Tax Assessment Tax Assessment Total Assessment is a certain percentage of the fair market value that is determined by local assessors to be the total taxable value of land and additions on the property. | Land | Improvement |
|---|---|---|---|---|
| 2025 | $5,610 | $1,193,500 | $416,800 | $776,700 |
| 2024 | $5,610 | $1,058,500 | $405,800 | $652,700 |
| 2023 | $5,741 | $1,021,100 | $318,200 | $702,900 |
| 2022 | $5,978 | $1,046,000 | $311,900 | $734,100 |
| 2021 | $5,171 | $821,400 | $250,400 | $571,000 |
| 2020 | $4,947 | $737,200 | $238,500 | $498,700 |
| 2019 | $4,909 | $717,100 | $225,000 | $492,100 |
| 2018 | $4,667 | $675,500 | $225,000 | $450,500 |
| 2017 | $4,148 | $596,900 | $225,000 | $371,900 |
| 2016 | $4,341 | $587,100 | $175,500 | $411,600 |
| 2015 | $4,510 | $594,100 | $187,200 | $406,900 |
| 2014 | $4,321 | $559,900 | $178,800 | $381,100 |
Source: Public Records
Map
Nearby Homes
- 9297 S Avignon Place
- 9121 S Hidden Peak Dr
- 9095 S 1150 W
- 1184 W Michaelsen Way
- 1116 W 9440 S
- 8976 S 1050 W
- 9332 S Chartres Ave
- 885 W Chartres Ave
- 9532 S Willow Trail Way
- 9141 S Little Creek Dr
- 8686 S Temple Dr
- 8843 Capernaum Rd
- 8772 S Midvalley Dr
- 662 W Jefferson Cove
- 9144 S Jefferson Place
- 8713 Mountain Meadow Dr
- 8686 Covewood Place
- 1424 Stone Meadow Dr
- 1352 W 8780 S
- 1254 W 8680 S
- 1063 W Albion View Cir Unit 35
- 1057 W Albion View Cir
- 1057 W Albion View Cir Unit 36
- 1058 W Albion View Cir Unit 34
- 9263 S Penrith Way Unit 103
- 9247 S Penrith Way
- 9229 S Penrith Way Unit 105
- 1054 W Alpine Ridge Cir
- 1054 Alpine Ridge Cir
- 1062 W Alpine Ridge Cir Unit 42
- 1062 W Alpine Ridge Cir
- 1056 W Albion View Cir Unit 33
- 1056 Albion View Cir
- 1049 W Albion View Cir Unit 37
- 9281 S Penrith Way Unit 102
- 1046 Alpine Ridge Cir
- 1046 W Alpine Ridge Cir
- 1044 W Albion View Cir
- 1044 Albion View Cir
- 1039 W Albion View Cir Unit 38