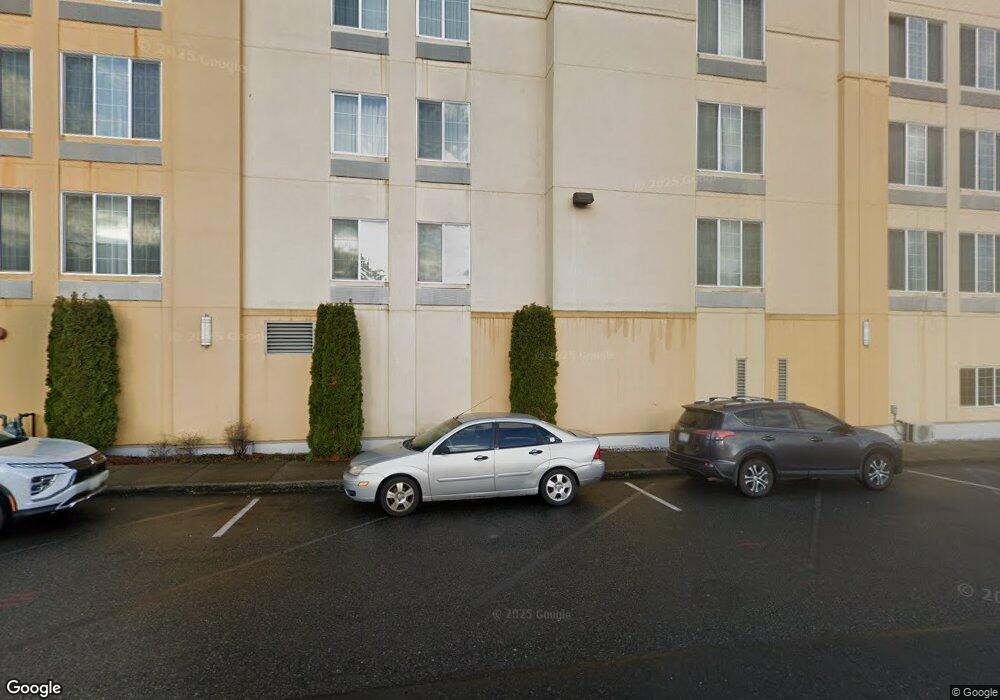
1063 W Bakerview Rd Bellingham, WA 98226
Meridian NeighborhoodEstimated Value: $11,652,708
2
Beds
3
Baths
50,343
Sq Ft
$231/Sq Ft
Est. Value
About This Home
This home is located at 1063 W Bakerview Rd, Bellingham, WA 98226 and is currently estimated at $11,652,708, approximately $231 per square foot. 1063 W Bakerview Rd is a home located in Whatcom County with nearby schools including Cordata Elementary School, Shuksan Middle School, and Squalicum High School.
Ownership History
Date
Name
Owned For
Owner Type
Purchase Details
Closed on
Aug 12, 2010
Sold by
Citadel Inc
Bought by
Parador Inc
Current Estimated Value
Purchase Details
Closed on
Dec 23, 2009
Sold by
Colman Management Co Llc
Bought by
Citadel Inc
Purchase Details
Closed on
Nov 28, 2005
Sold by
Jones Jeremy and Jones Amanda M
Bought by
Colman Management Co Llc
Home Financials for this Owner
Home Financials are based on the most recent Mortgage that was taken out on this home.
Original Mortgage
$500,000
Interest Rate
6.07%
Mortgage Type
Commercial
Purchase Details
Closed on
Apr 4, 2000
Sold by
Elsner Mike and Elsner Kristi
Bought by
Jones Jeremy and Jones Amanda M
Create a Home Valuation Report for This Property
The Home Valuation Report is an in-depth analysis detailing your home's value as well as a comparison with similar homes in the area
Home Values in the Area
Average Home Value in this Area
Purchase History
| Date | Buyer | Sale Price | Title Company |
|---|---|---|---|
| Parador Inc | -- | None Available | |
| Citadel Inc | $625,280 | Stewart Title Company | |
| Colman Management Co Llc | $750,280 | Whatcom Land Title | |
| Jones Jeremy | $276,000 | First American Title Ins |
Source: Public Records
Mortgage History
| Date | Status | Borrower | Loan Amount |
|---|---|---|---|
| Previous Owner | Colman Management Co Llc | $500,000 |
Source: Public Records
Tax History Compared to Growth
Tax History
| Year | Tax Paid | Tax Assessment Tax Assessment Total Assessment is a certain percentage of the fair market value that is determined by local assessors to be the total taxable value of land and additions on the property. | Land | Improvement |
|---|---|---|---|---|
| 2024 | $72,152 | $9,279,409 | $1,259,875 | $8,019,534 |
| 2023 | $72,152 | $9,279,409 | $1,259,875 | $8,019,534 |
| 2022 | $60,210 | $6,482,148 | $1,159,085 | $5,323,063 |
| 2021 | $67,552 | $6,482,148 | $1,159,085 | $5,323,063 |
| 2020 | $54,676 | $6,863,720 | $1,058,295 | $5,805,425 |
| 2019 | $54,533 | $5,369,744 | $1,007,900 | $4,361,844 |
| 2018 | $63,782 | $5,369,744 | $1,007,900 | $4,361,844 |
| 2017 | $61,029 | $5,369,744 | $1,007,900 | $4,361,844 |
| 2016 | $58,623 | $5,369,744 | $1,007,900 | $4,361,844 |
| 2015 | $54,918 | $5,369,744 | $1,007,900 | $4,361,844 |
| 2014 | -- | $4,867,252 | $592,645 | $4,274,607 |
| 2013 | -- | $592,645 | $592,645 | $0 |
Source: Public Records
Map
Nearby Homes
- 1217 Garland Ln
- 0 Home Ln
- 1365 Mahogany Ave
- 1360 Talus Way
- 617 Sunflower Ln Unit E2
- 4252 Northwest Dr
- 1366 Talus Way
- 1368 Talus Way
- 1370 Talus Way
- 4015 Eliza Ave Unit 120
- 4015 Eliza Ave Unit 31
- 4226 Melrose Ln
- 4230 Melrose Ln
- 4232 Melrose Ln
- 4228 Melrose Ln
- 3085 W Maplewood Ave
- 4122 Silverbell Way
- 4225 Ambrosia Ln
- 4227 Ambrosia Ln
- 4229 Ambrosia Ln
- 1075 W Bakerview Rd
- 2891 W Bakerview Rd
- 1108 W Bakerview Rd
- 4085 Home Rd
- 1065 W Bakerview Rd
- 1120 W Bakerview Rd
- 1348 W Bakerview Rd
- 4063 Northwest Ave
- 4071 Home Rd
- 1210 W Bakerview Rd
- 9 XX W Bakerview Rd
- 1235 W Bakerview Rd
- 1237 W Bakerview Rd
- 1240 W Bakerview Rd
- 4149 Northwest Dr
- 4050 Northwest Ave
- 921 Bakerview Rd
- 4030 Northwest Ave
- 4130 Aldrich Rd
- 1201 Garland Ln