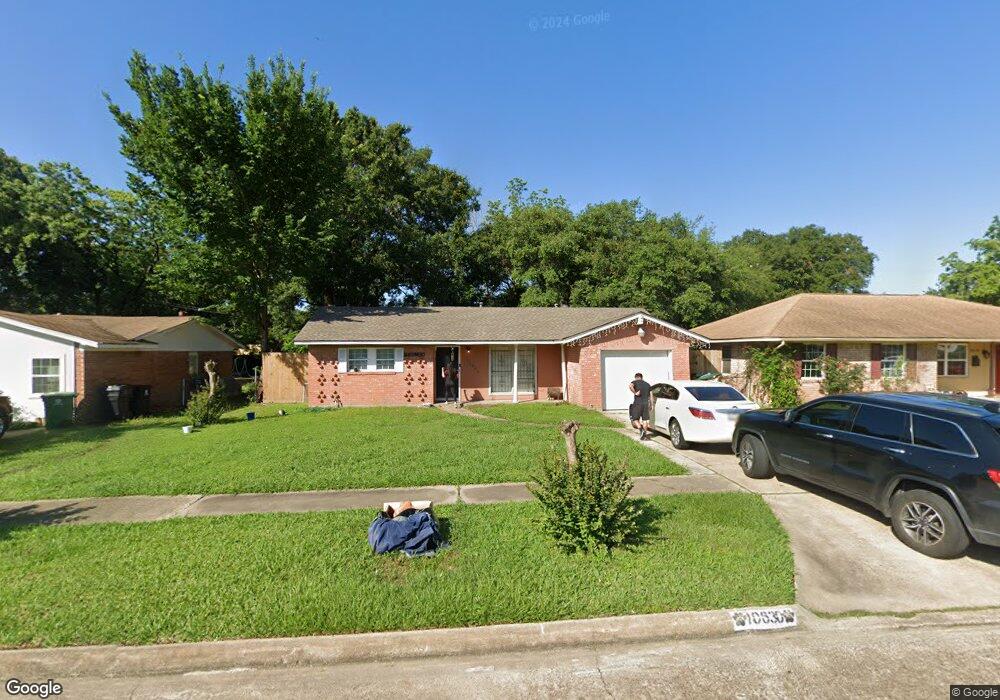
10630 Thornlea Dr Houston, TX 77089
Southbelt-Ellington NeighborhoodEstimated Value: $181,260 - $213,000
3
Beds
1
Bath
1,224
Sq Ft
$162/Sq Ft
Est. Value
About This Home
This home is located at 10630 Thornlea Dr, Houston, TX 77089 and is currently estimated at $198,815, approximately $162 per square foot. 10630 Thornlea Dr is a home located in Harris County with nearby schools including Meador Elementary School, Morris Middle School, and Beverly Hill Intermediate School.
Ownership History
Date
Name
Owned For
Owner Type
Purchase Details
Closed on
Dec 12, 2014
Sold by
Rodriguez Jose De Jesus and Rodriguez Gabriela
Bought by
Guerrero Nancy Graciela
Current Estimated Value
Home Financials for this Owner
Home Financials are based on the most recent Mortgage that was taken out on this home.
Original Mortgage
$89,842
Outstanding Balance
$68,691
Interest Rate
3.87%
Mortgage Type
FHA
Estimated Equity
$130,124
Create a Home Valuation Report for This Property
The Home Valuation Report is an in-depth analysis detailing your home's value as well as a comparison with similar homes in the area
Home Values in the Area
Average Home Value in this Area
Purchase History
| Date | Buyer | Sale Price | Title Company |
|---|---|---|---|
| Guerrero Nancy Graciela | -- | Texas American Title Co |
Source: Public Records
Mortgage History
| Date | Status | Borrower | Loan Amount |
|---|---|---|---|
| Open | Guerrero Nancy Graciela | $89,842 |
Source: Public Records
Tax History Compared to Growth
Tax History
| Year | Tax Paid | Tax Assessment Tax Assessment Total Assessment is a certain percentage of the fair market value that is determined by local assessors to be the total taxable value of land and additions on the property. | Land | Improvement |
|---|---|---|---|---|
| 2025 | $4,167 | $163,676 | $52,650 | $111,026 |
| 2024 | $4,167 | $166,144 | $52,650 | $113,494 |
| 2023 | $4,167 | $166,144 | $52,650 | $113,494 |
| 2022 | $3,884 | $151,699 | $52,650 | $99,049 |
| 2021 | $3,436 | $127,890 | $38,610 | $89,280 |
| 2020 | $3,441 | $125,514 | $38,610 | $86,904 |
| 2019 | $3,491 | $121,087 | $29,835 | $91,252 |
| 2018 | $1,339 | $95,449 | $27,027 | $68,422 |
| 2017 | $2,629 | $95,449 | $27,027 | $68,422 |
| 2016 | $2,400 | $88,758 | $27,027 | $61,731 |
| 2015 | $1,545 | $79,229 | $19,305 | $59,924 |
| 2014 | $1,545 | $73,639 | $19,305 | $54,334 |
Source: Public Records
Map
Nearby Homes
- 10442 Southport Dr
- 10619 Wheaton Dr
- 10614 Sabo Rd
- 10207 Rambling Trail
- 10214 Buena Park Dr
- 10823 Overlea Dr
- 10211 Glenmawr Dr
- 10906 Green Arbor Dr
- 10815 Ritow St
- 10147 Torrington Ln
- 10906 Keese Dr
- 11433 Sabo Rd
- 11303 Caribbean Ln
- 11311 Caribbean Ln
- 10018 Ramey St
- 9914 Sumerlin St
- 9743 Santa Monica Blvd
- 9811 Mango St
- 10507 Kirkhill Dr
- 9711 Ebb St
- 10626 Thornlea Dr
- 10634 Thornlea Dr
- 10622 Thornlea Dr
- 10631 Seaford Dr
- 10627 Seaford Dr
- 10635 Seaford Dr
- 10503 Southport Dr
- 10502 Rambling Trail
- 10623 Seaford Dr
- 10618 Thornlea Dr
- 10619 Seaford Dr
- 10507 Southport Dr
- 10506 Rambling Trail
- 10434 Southport Dr
- 10438 Southport Dr
- 10614 Thornlea Dr
- 10430 Southport Dr
- 000 Seaford Dr
- 10615 Seaford Dr
- 10426 Southport Dr