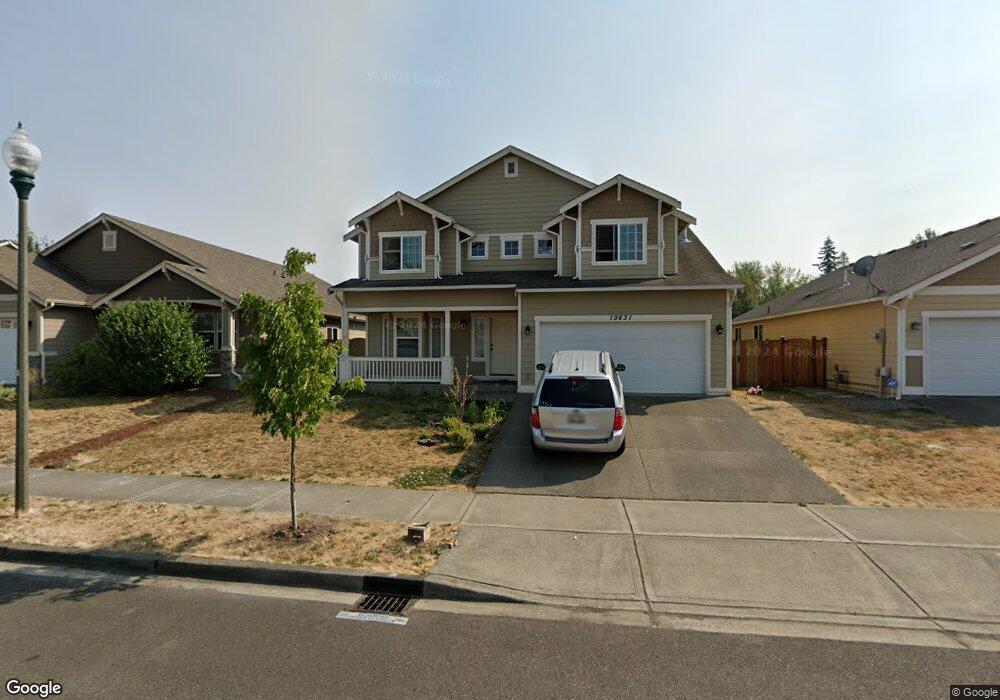
10631 SE 273rd Ct Kent, WA 98030
East Hill NeighborhoodEstimated Value: $724,038 - $814,000
4
Beds
3
Baths
2,290
Sq Ft
$340/Sq Ft
Est. Value
About This Home
This home is located at 10631 SE 273rd Ct, Kent, WA 98030 and is currently estimated at $779,010, approximately $340 per square foot. 10631 SE 273rd Ct is a home located in King County with nearby schools including Meadow Ridge Elementary School, Kent-Meridian High School, and Rainier Christian Schools-Kent View Elementary.
Ownership History
Date
Name
Owned For
Owner Type
Purchase Details
Closed on
Feb 10, 2017
Sold by
Xiong Ter
Bought by
Xiong Albert Dang and Lor Ong
Current Estimated Value
Home Financials for this Owner
Home Financials are based on the most recent Mortgage that was taken out on this home.
Original Mortgage
$203,200
Outstanding Balance
$168,241
Interest Rate
4.2%
Mortgage Type
New Conventional
Estimated Equity
$610,769
Purchase Details
Closed on
Nov 12, 2010
Sold by
Eagle Creek Land & Development Llc
Bought by
Xiong Albert Dang and Lor Ong
Home Financials for this Owner
Home Financials are based on the most recent Mortgage that was taken out on this home.
Original Mortgage
$224,000
Interest Rate
4.23%
Mortgage Type
New Conventional
Purchase Details
Closed on
Jun 30, 2010
Sold by
Haleys Ridge Llc
Bought by
Eagle Creek Land & Development Llc
Create a Home Valuation Report for This Property
The Home Valuation Report is an in-depth analysis detailing your home's value as well as a comparison with similar homes in the area
Home Values in the Area
Average Home Value in this Area
Purchase History
| Date | Buyer | Sale Price | Title Company |
|---|---|---|---|
| Xiong Albert Dang | -- | First American | |
| Xiong Albert Dang | $280,000 | Chicago Title | |
| Eagle Creek Land & Development Llc | -- | Chicago Title |
Source: Public Records
Mortgage History
| Date | Status | Borrower | Loan Amount |
|---|---|---|---|
| Open | Xiong Albert Dang | $203,200 | |
| Closed | Xiong Albert Dang | $224,000 |
Source: Public Records
Tax History Compared to Growth
Tax History
| Year | Tax Paid | Tax Assessment Tax Assessment Total Assessment is a certain percentage of the fair market value that is determined by local assessors to be the total taxable value of land and additions on the property. | Land | Improvement |
|---|---|---|---|---|
| 2024 | $6,766 | $669,000 | $216,000 | $453,000 |
| 2023 | $6,807 | $589,000 | $160,000 | $429,000 |
| 2022 | $6,190 | $652,000 | $150,000 | $502,000 |
| 2021 | $5,680 | $519,000 | $125,000 | $394,000 |
| 2020 | $5,550 | $453,000 | $109,000 | $344,000 |
| 2018 | $4,805 | $420,000 | $104,000 | $316,000 |
| 2017 | $4,434 | $360,000 | $95,000 | $265,000 |
| 2016 | $4,318 | $339,000 | $95,000 | $244,000 |
| 2015 | $4,309 | $313,000 | $87,000 | $226,000 |
| 2014 | -- | $306,000 | $85,000 | $221,000 |
| 2013 | -- | $245,000 | $78,000 | $167,000 |
Source: Public Records
Map
Nearby Homes
- 27120 105th Place SE
- 27109 109th Ct SE
- 27114 109th Ct SE
- 320 XX 105th Ave SE
- 11104 SE 283rd St
- 11720 SE 272nd Place
- 11730 SE 277th Place
- 27018 117th Place SE
- 1409 51st Place NE
- 11732 SE 269th Place
- 1317 52nd St NE
- 26331 116th Ave SE Unit G104
- 26339 116th Ave SE Unit I102
- 26339 116th Ave SE Unit I105
- 10822 SE 260th St Unit 2B1
- 26221 116th Ave SE Unit F104
- 26221 116th Ave SE Unit F103
- 10700 SE 260th St Unit J101
- 10700 SE 260th St Unit M101
- 10700 SE 260th St Unit D101
- 10627 SE 273rd Ct
- 10707 SE 273rd Ct
- 10713 SE 273rd Ct
- 10621 SE 273rd Ct
- 10630 SE 273rd Ct
- 10622 SE 273rd Ct
- 10719 SE 273rd Ct
- 10615 SE 273rd Ct
- 27322 107th Place SE
- 10607 SE 273rd Ct
- 27316 107th Place SE
- 10602 SE 273rd Ct
- 27312 107th Place SE
- 10601 SE 273rd Ct
- 10606 SE 273rd Ct
- 27304 107th Place SE
- 10612 SE 273rd Ct
- 10529 SE 273rd Place
- 10715 SE 272nd St
- 27312 105th Ave SE