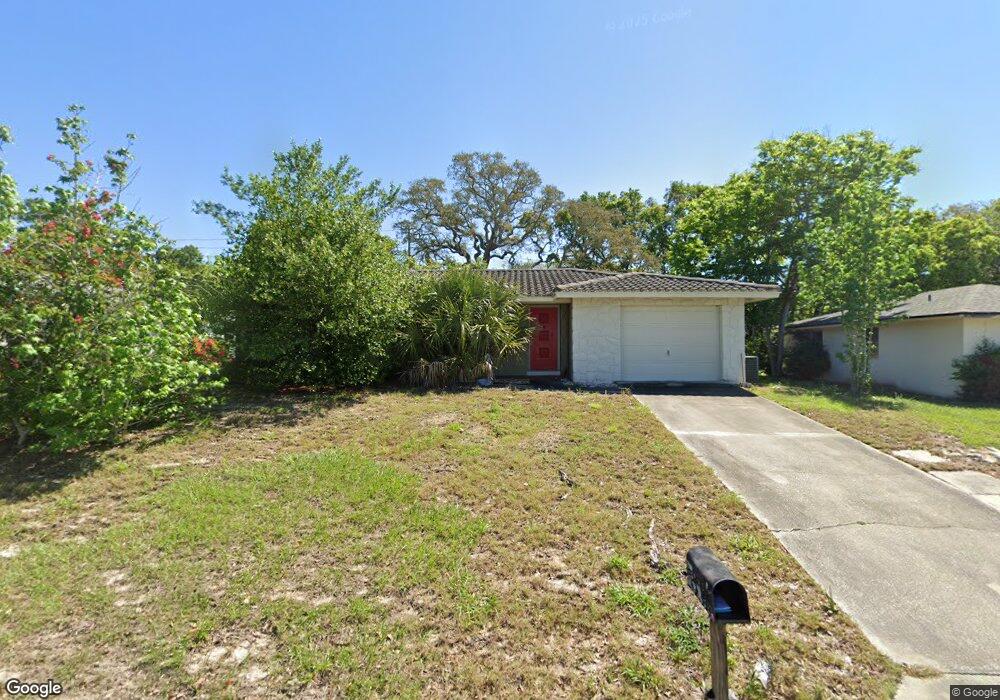
10632 Laburnum Dr Port Richey, FL 34668
Estimated Value: $171,000 - $234,000
2
Beds
2
Baths
1,663
Sq Ft
$122/Sq Ft
Est. Value
About This Home
This home is located at 10632 Laburnum Dr, Port Richey, FL 34668 and is currently estimated at $202,186, approximately $121 per square foot. 10632 Laburnum Dr is a home located in Pasco County with nearby schools including Schrader Elementary School, Bayonet Point Middle School, and Fivay High School.
Ownership History
Date
Name
Owned For
Owner Type
Purchase Details
Closed on
Dec 8, 2021
Sold by
Mnf Iii Acquisitions Llc
Bought by
Mnf Iii W1 Llc
Current Estimated Value
Purchase Details
Closed on
Jul 6, 2021
Sold by
Portfolio 100 Llc
Bought by
Mnf Iii Acquisitions Llc
Purchase Details
Closed on
Oct 31, 2016
Sold by
Nv Acquisition Management Llc
Bought by
Portfolio 100 Llc
Purchase Details
Closed on
Oct 1, 2016
Bought by
Portfolio 100 Llc
Purchase Details
Closed on
Oct 28, 2015
Sold by
Friis Paul and Friis Janet
Bought by
Nv Acquisition Management Llc
Purchase Details
Closed on
Aug 29, 2012
Sold by
First Methodist Church Of New Port Riche
Bought by
Friis Janet
Purchase Details
Closed on
Aug 16, 2012
Sold by
Friis Janet
Bought by
Friis Paul and Friis Janet
Create a Home Valuation Report for This Property
The Home Valuation Report is an in-depth analysis detailing your home's value as well as a comparison with similar homes in the area
Home Values in the Area
Average Home Value in this Area
Purchase History
| Date | Buyer | Sale Price | Title Company |
|---|---|---|---|
| Mnf Iii W1 Llc | -- | Westcor Investor Services | |
| Mnf Iii W1 Llc | $100 | None Listed On Document | |
| Mnf Iii Acquisitions Llc | $129,400 | Serenity Title Llc | |
| Mnf Iii Acquisitions Llc | $129,400 | New Title Company Name | |
| Portfolio 100 Llc | -- | Fidelity National Title Of F | |
| Portfolio 100 Llc | $100 | -- | |
| Nv Acquisition Management Llc | $47,500 | Platinum Title Llc | |
| Friis Janet | $6,400 | Attorney | |
| Friis Paul | -- | Attorney |
Source: Public Records
Tax History Compared to Growth
Tax History
| Year | Tax Paid | Tax Assessment Tax Assessment Total Assessment is a certain percentage of the fair market value that is determined by local assessors to be the total taxable value of land and additions on the property. | Land | Improvement |
|---|---|---|---|---|
| 2025 | $3,372 | $179,100 | $39,670 | $139,430 |
| 2024 | $3,372 | $186,618 | $39,670 | $146,948 |
| 2023 | $3,169 | $168,110 | $0 | $0 |
| 2022 | $2,611 | $152,830 | $22,620 | $130,210 |
| 2021 | $1,625 | $107,752 | $20,125 | $87,627 |
| 2020 | $1,496 | $98,439 | $12,870 | $85,569 |
| 2019 | $1,375 | $87,575 | $12,870 | $74,705 |
| 2018 | $1,237 | $74,758 | $12,870 | $61,888 |
| 2017 | $1,110 | $59,895 | $11,495 | $48,400 |
| 2016 | $958 | $48,564 | $8,195 | $40,369 |
| 2015 | $875 | $42,713 | $7,315 | $35,398 |
| 2014 | $839 | $41,762 | $7,315 | $34,447 |
Source: Public Records
Map
Nearby Homes
- 7931 Bracken Dr
- 7919 Tropicana Dr
- 10610 Mosquero Dr
- 8040 Pasadena Dr
- 7814 Waxwood Dr
- 8101 Casuarina Dr
- 10803 Hachita Dr
- 10619 Mira Vista Dr
- 10824 Oldham Rd
- 8140 San Felipe Ct
- 10740 Manchester Rd
- 10841 Piccadilly Rd
- 8020 Jasmine Blvd
- 7735 Canna Dr
- 10521 Mira Vista Dr
- 10819 Los Santos Dr
- 10800 Leeds Rd
- 8030 San Bernardino Dr
- 10831 Manchester Rd
- 10401 Leaning Oak Dr
- 10638 Laburnum Dr
- 10626 Laburnum Dr
- 10647 Salamanca Dr
- 10643 Salamanca Dr
- 10651 Salamanca Dr Unit 5
- 10651 Salamanca Dr
- 10702 Laburnum Dr
- 10622 Laburnum Dr
- 7925 Waxwood Dr
- 7924 Waxwood Dr
- 10639 Salamanca Dr
- 10616 Laburnum Dr
- 10706 Laburnum Dr
- 10705 Laburnum Dr
- 10707 Salamanca Dr
- 7919 Waxwood Dr
- 7918 Waxwood Dr
- 7925 Talisman Dr
- 10635 Salamanca Dr
- 8014 Pasadena Dr