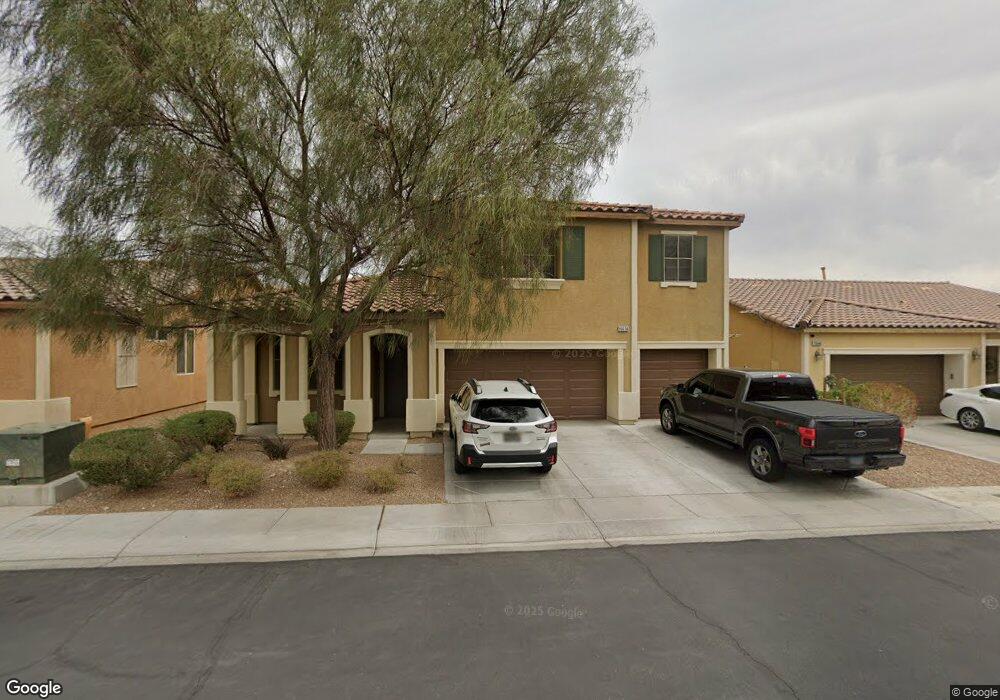
10638 Tamaruga Ct Las Vegas, NV 89179
Mountains Edge NeighborhoodEstimated Value: $547,870 - $581,000
4
Beds
3
Baths
2,695
Sq Ft
$210/Sq Ft
Est. Value
About This Home
This home is located at 10638 Tamaruga Ct, Las Vegas, NV 89179 and is currently estimated at $566,968, approximately $210 per square foot. 10638 Tamaruga Ct is a home located in Clark County with nearby schools including Jones Blackhurst Elementary School, Desert Oasis High School, and Doral Academy Cactus.
Ownership History
Date
Name
Owned For
Owner Type
Purchase Details
Closed on
Jun 1, 2020
Sold by
Adler Erinn V and Adler Anthony D
Bought by
Adler Anthony David
Current Estimated Value
Home Financials for this Owner
Home Financials are based on the most recent Mortgage that was taken out on this home.
Original Mortgage
$208,105
Outstanding Balance
$146,629
Interest Rate
3.3%
Mortgage Type
New Conventional
Estimated Equity
$420,339
Purchase Details
Closed on
Oct 24, 2016
Sold by
Alder Erinn V
Bought by
Adler Erinn V and Adler Anthony D
Purchase Details
Closed on
Apr 16, 2010
Sold by
Pardee Homes Of Nevada
Bought by
Johnson Erin and Adler Renee
Home Financials for this Owner
Home Financials are based on the most recent Mortgage that was taken out on this home.
Original Mortgage
$238,949
Interest Rate
5.25%
Mortgage Type
FHA
Create a Home Valuation Report for This Property
The Home Valuation Report is an in-depth analysis detailing your home's value as well as a comparison with similar homes in the area
Home Values in the Area
Average Home Value in this Area
Purchase History
| Date | Buyer | Sale Price | Title Company |
|---|---|---|---|
| Adler Anthony David | -- | Lawyers Title Las Vegas | |
| Adler Anthony David | -- | None Available | |
| Adler Erinn V | -- | Nevada Title Co | |
| Johnson Erinn | -- | Nevada Title Las Vegas | |
| Johnson Erin | $243,358 | Lawyers Title Of Nevada Mid |
Source: Public Records
Mortgage History
| Date | Status | Borrower | Loan Amount |
|---|---|---|---|
| Open | Adler Anthony David | $208,105 | |
| Previous Owner | Johnson Erin | $238,949 |
Source: Public Records
Tax History Compared to Growth
Tax History
| Year | Tax Paid | Tax Assessment Tax Assessment Total Assessment is a certain percentage of the fair market value that is determined by local assessors to be the total taxable value of land and additions on the property. | Land | Improvement |
|---|---|---|---|---|
| 2025 | $3,189 | $163,051 | $40,250 | $122,801 |
| 2024 | $3,096 | $163,051 | $40,250 | $122,801 |
| 2023 | $2,406 | $155,609 | $40,250 | $115,359 |
| 2022 | $3,006 | $136,509 | $31,500 | $105,009 |
| 2021 | $2,919 | $129,162 | $29,750 | $99,412 |
| 2020 | $2,831 | $125,333 | $27,300 | $98,033 |
| 2019 | $2,653 | $121,840 | $25,550 | $96,290 |
| 2018 | $2,576 | $112,934 | $21,000 | $91,934 |
| 2017 | $3,036 | $103,517 | $21,000 | $82,517 |
| 2016 | $2,406 | $93,662 | $15,750 | $77,912 |
| 2015 | $2,401 | $82,608 | $12,250 | $70,358 |
| 2014 | $2,331 | $77,103 | $8,750 | $68,353 |
Source: Public Records
Map
Nearby Homes
- 10604 Entrance Arch St
- 7510 Perla Del Mar Ave
- 10743 Henesco Bay St
- 7513 Brisa Del Mar Ave
- 10739 Centerville Bay Ct
- 7468 Wellfleet Bay Ave
- 7409 Painted Mural Ave
- 7596 Eastham Bay Ave
- 7497 Dequon Bay Ct
- 10568 Peach Creek St
- 10657 Cave Ridge St
- 7704 Lots Hills Dr
- 7715 Peaceful Trellis Dr
- 10795 Yarmouth Bay Ct
- 7748 Jasmine Falls Dr
- 7558 Schuders Ave
- 7578 Schuders Ave
- 7312 Acopa Ave
- 10598 Cliff Lake St
- 10479 Asana St
- 10628 Tamaruga Ct
- 10648 Tamaruga Ct
- 10637 Stronghold Ct
- 10647 Stronghold Ct
- 10618 Tamaruga Ct
- 10627 Stronghold Ct
- 10639 Tamaruga Ct
- 10629 Tamaruga Ct
- 10649 Tamaruga Ct
- 10619 Tamaruga Ct
- 10608 Tamaruga Ct
- 7507 Horizon Rock Ave
- 7497 Horizon Rock Ave
- 10617 Stronghold Ct
- 10617 Stronghold Ct Unit na
- 7517 Horizon Rock Ave
- 10609 Tamaruga Ct
- 7487 Horizon Rock Ave
- 10636 Stronghold Ct
- 7527 Horizon Rock Ave