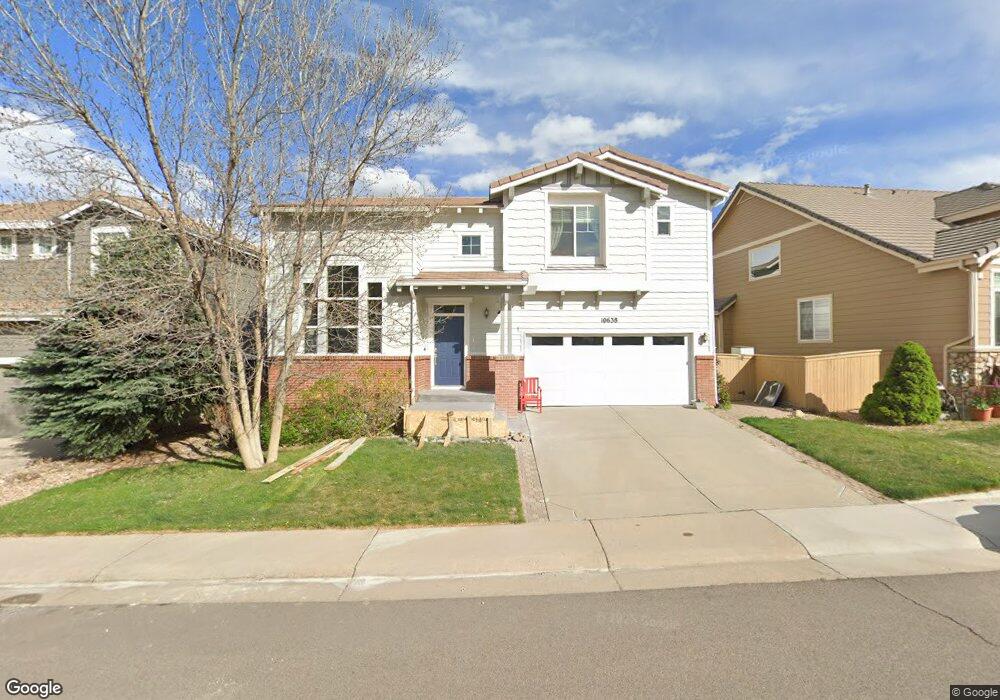
10638 Wynspire Way Highlands Ranch, CO 80130
Southridge NeighborhoodEstimated Value: $714,441 - $773,000
4
Beds
3
Baths
3,449
Sq Ft
$215/Sq Ft
Est. Value
About This Home
This home is located at 10638 Wynspire Way, Highlands Ranch, CO 80130 and is currently estimated at $742,110, approximately $215 per square foot. 10638 Wynspire Way is a home located in Douglas County with nearby schools including Heritage Elementary School, Mountain Ridge Middle School, and Mountain Vista High School.
Ownership History
Date
Name
Owned For
Owner Type
Purchase Details
Closed on
Oct 28, 2002
Sold by
Richmond American Homes Of Colorado Inc
Bought by
Tran Loi Xuong
Current Estimated Value
Home Financials for this Owner
Home Financials are based on the most recent Mortgage that was taken out on this home.
Original Mortgage
$232,800
Outstanding Balance
$97,438
Interest Rate
6.01%
Estimated Equity
$644,672
Purchase Details
Closed on
Oct 7, 2002
Sold by
Richmond American Homes Of Colo Inc Attn
Bought by
Tran Loi Xuong
Home Financials for this Owner
Home Financials are based on the most recent Mortgage that was taken out on this home.
Original Mortgage
$232,800
Outstanding Balance
$97,438
Interest Rate
6.01%
Estimated Equity
$644,672
Purchase Details
Closed on
Dec 15, 2000
Sold by
Shea Homes Lp
Bought by
Richmond American Homes Of Colo Inc
Create a Home Valuation Report for This Property
The Home Valuation Report is an in-depth analysis detailing your home's value as well as a comparison with similar homes in the area
Home Values in the Area
Average Home Value in this Area
Purchase History
| Date | Buyer | Sale Price | Title Company |
|---|---|---|---|
| Tran Loi Xuong | $291,000 | -- | |
| Tran Loi Xuong | $291,000 | -- | |
| Richmond American Homes Of Colo Inc | $11,306,000 | -- |
Source: Public Records
Mortgage History
| Date | Status | Borrower | Loan Amount |
|---|---|---|---|
| Open | Tran Loi Xuong | $232,800 |
Source: Public Records
Tax History Compared to Growth
Tax History
| Year | Tax Paid | Tax Assessment Tax Assessment Total Assessment is a certain percentage of the fair market value that is determined by local assessors to be the total taxable value of land and additions on the property. | Land | Improvement |
|---|---|---|---|---|
| 2024 | $4,489 | $51,320 | $10,680 | $40,640 |
| 2023 | $4,481 | $51,320 | $10,680 | $40,640 |
| 2022 | $3,257 | $35,650 | $7,840 | $27,810 |
| 2021 | $3,388 | $35,650 | $7,840 | $27,810 |
| 2020 | $3,281 | $35,380 | $6,910 | $28,470 |
| 2019 | $3,293 | $35,380 | $6,910 | $28,470 |
| 2018 | $2,961 | $31,330 | $6,350 | $24,980 |
| 2017 | $2,696 | $31,330 | $6,350 | $24,980 |
| 2016 | $2,687 | $30,650 | $5,770 | $24,880 |
| 2015 | $2,745 | $30,650 | $5,770 | $24,880 |
| 2014 | $2,413 | $24,880 | $6,930 | $17,950 |
Source: Public Records
Map
Nearby Homes
- 10653 Briarglen Cir
- 5001 Laurelglen Ln
- 10580 Parkington Ln Unit B
- 10547 Laurelglen Cir
- 4656 Ketchwood Cir
- 3851 Stonebrush Dr Unit 11B
- 10896 Valleybrook Cir
- 10535 Ashfield St
- 10582 Ashfield St
- 10832 Hickory Ridge Ln
- 4287 Brookwood Place
- 3853 Charterwood Dr
- 10753 Cedar Brook Ln
- 10360 Tracewood Ct
- 4965 Huntwick Place
- 11036 Glengate Cir
- 10358 Kelliwood Way
- 3229 Green Haven Cir
- 10728 Evondale St
- 10994 Shadowbrook Cir
- 10644 Wynspire Way
- 10632 Wynspire Way
- 10654 Wynspire Way
- 10626 Wynspire Way
- 10621 Briarglen Cir
- 10617 Briarglen Cir
- 10639 Wynspire Way
- 10625 Briarglen Cir
- 10629 Wynspire Way
- 10620 Wynspire Way
- 10664 Wynspire Way
- 10613 Briarglen Cir
- 10705 Cliffrose Way
- 10629 Briarglen Cir
- 10623 Wynspire Way
- 10614 Wynspire Way
- 10695 Cliffrose Way
- 10674 Wynspire Way
- 10655 Wynspire Rd
- 10640 Cliffrose Way