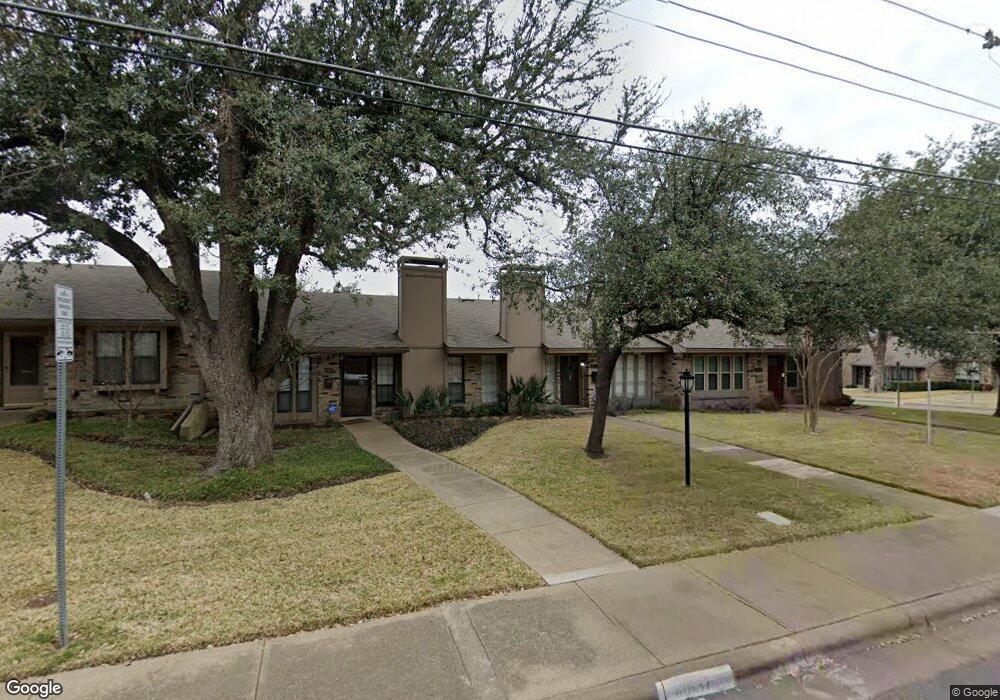
10639-7 Stone Canyon Rd Unit 17 Dallas, TX 75230
Estimated Value: $284,000 - $331,000
2
Beds
2
Baths
1,210
Sq Ft
$257/Sq Ft
Est. Value
About This Home
This home is located at 10639-7 Stone Canyon Rd Unit 17, Dallas, TX 75230 and is currently estimated at $311,213, approximately $257 per square foot. 10639-7 Stone Canyon Rd Unit 17 is a home located in Dallas County with nearby schools including Arthur Kramer Elementary School, Benjamin Franklin International Exploratory Academy, and Hillcrest High School.
Ownership History
Date
Name
Owned For
Owner Type
Purchase Details
Closed on
Dec 27, 2023
Sold by
Mccollum Amy and Mccollum Jonathan
Bought by
Ortegon Courtney and Ortegon Anthony
Current Estimated Value
Home Financials for this Owner
Home Financials are based on the most recent Mortgage that was taken out on this home.
Original Mortgage
$228,750
Outstanding Balance
$224,997
Interest Rate
7.29%
Mortgage Type
New Conventional
Estimated Equity
$86,216
Purchase Details
Closed on
Sep 21, 2015
Sold by
Monnat Daniel P
Bought by
Everett Amy
Purchase Details
Closed on
Apr 30, 2013
Sold by
Street Gustavus Leroy
Bought by
Monnat Daniel P
Home Financials for this Owner
Home Financials are based on the most recent Mortgage that was taken out on this home.
Original Mortgage
$124,485
Interest Rate
3.58%
Mortgage Type
Purchase Money Mortgage
Create a Home Valuation Report for This Property
The Home Valuation Report is an in-depth analysis detailing your home's value as well as a comparison with similar homes in the area
Home Values in the Area
Average Home Value in this Area
Purchase History
| Date | Buyer | Sale Price | Title Company |
|---|---|---|---|
| Ortegon Courtney | -- | None Listed On Document | |
| Everett Amy | -- | Rtt | |
| Monnat Daniel P | -- | Ltc |
Source: Public Records
Mortgage History
| Date | Status | Borrower | Loan Amount |
|---|---|---|---|
| Open | Ortegon Courtney | $228,750 | |
| Previous Owner | Monnat Daniel P | $124,485 |
Source: Public Records
Tax History Compared to Growth
Tax History
| Year | Tax Paid | Tax Assessment Tax Assessment Total Assessment is a certain percentage of the fair market value that is determined by local assessors to be the total taxable value of land and additions on the property. | Land | Improvement |
|---|---|---|---|---|
| 2025 | $6,750 | $305,000 | $70,000 | $235,000 |
| 2024 | $6,750 | $302,000 | $24,500 | $277,500 |
| 2023 | $6,750 | $248,050 | $24,500 | $223,550 |
| 2022 | $6,202 | $248,050 | $24,500 | $223,550 |
| 2021 | $6,288 | $238,370 | $24,500 | $213,870 |
| 2020 | $6,467 | $238,370 | $24,500 | $213,870 |
| 2019 | $6,782 | $238,370 | $24,500 | $213,870 |
| 2018 | $6,482 | $238,370 | $24,500 | $213,870 |
| 2017 | $5,265 | $193,600 | $24,500 | $169,100 |
| 2016 | $5,265 | $193,600 | $24,500 | $169,100 |
| 2015 | $3,668 | $128,260 | $24,500 | $103,760 |
| 2014 | $3,668 | $133,710 | $24,500 | $109,210 |
Source: Public Records
Map
Nearby Homes
- 10628 Northboro St Unit 10
- 10617 Stone Canyon Rd Unit 28
- 10820 Pagewood Dr Unit 2
- 7610 Highmont St Unit 4
- 7607 Pebblestone Dr Unit 9
- 10823 Pagewood Place
- 7510 Highmont St Unit 24
- 7509 Pebblestone Dr Unit 2
- 7503 Pebblestone Dr Unit 20
- 7603 Riverbrook Dr Unit 8
- 7609 Riverbrook Dr Unit 11
- 10706 Royal Park Dr
- 10537 Egret Ln
- 10590 High Hollows Dr Unit 287
- 10564 High Hollows Dr Unit 253
- 10530 Stone Canyon Rd Unit 208
- 10578 High Hollows Dr Unit 266S
- 10584 High Hollows Dr Unit U-274
- 10584 High Hollows Dr Unit 176U
- 10562 High Hollows Dr Unit 246M
- 10639 Stone Canyon Rd Unit 7
- 10639 Stone Canyon Rd Unit 17
- 10637 Stone Canyon Rd Unit 7
- 10637 Stone Canyon Rd Unit 18
- 10641 Stone Canyon Rd Unit 7
- 10635 Stone Canyon Rd Unit 7
- 10635 Stone Canyon Rd Unit 19
- 10633 Stone Canyon Rd Unit 7
- 10633 Stone Canyon Rd Unit 20
- 10631 Stone Canyon Rd Unit 7
- 10631 Stone Canyon Rd Unit 21
- 10636 Northboro St Unit 8
- 10634 Northboro St Unit 8
- 10634 Northboro St Unit 13
- 10638 Northboro St Unit 8
- 10632 Northboro St Unit 8
- 10629 Stone Canyon Rd Unit 7
- 10630 Northboro St Unit 8
- 10630 Northboro St Unit 11
- 10817 Sandpiper Ln Unit 1