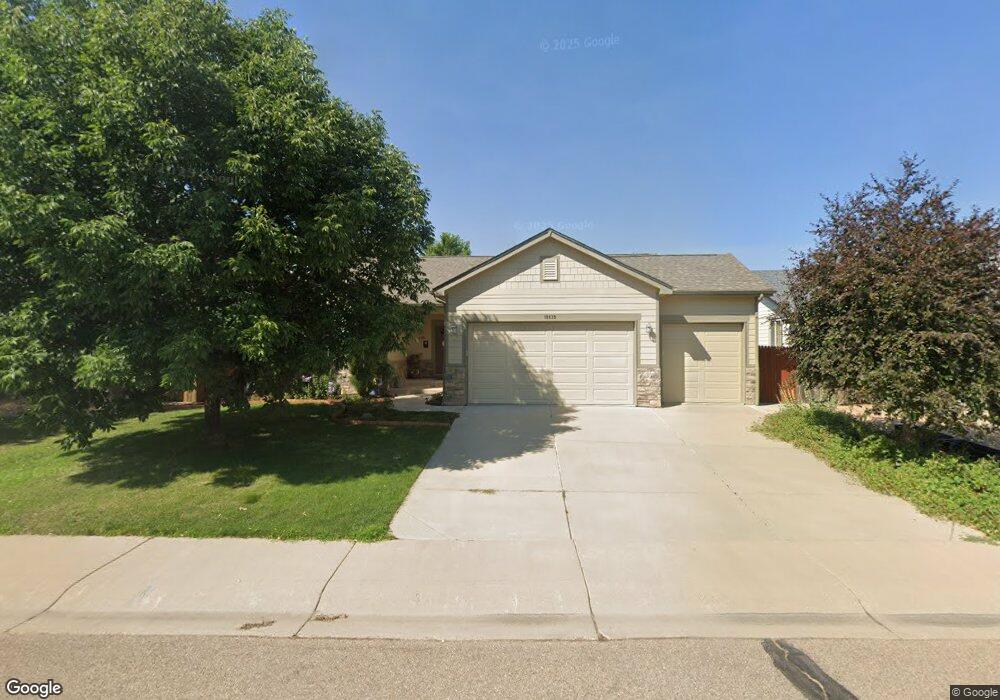
10639 Coal Mine St Firestone, CO 80504
Estimated Value: $562,287 - $606,000
5
Beds
3
Baths
1,742
Sq Ft
$335/Sq Ft
Est. Value
About This Home
This home is located at 10639 Coal Mine St, Firestone, CO 80504 and is currently estimated at $584,072, approximately $335 per square foot. 10639 Coal Mine St is a home located in Weld County with nearby schools including Centennial Elementary School, Coal Ridge Middle School, and Mead High School DUPLICATE DUPLICATE.
Ownership History
Date
Name
Owned For
Owner Type
Purchase Details
Closed on
May 22, 2006
Sold by
Niwot Custom Homes Llc
Bought by
Fugate Kristi
Current Estimated Value
Home Financials for this Owner
Home Financials are based on the most recent Mortgage that was taken out on this home.
Original Mortgage
$266,400
Outstanding Balance
$155,168
Interest Rate
6.5%
Mortgage Type
Fannie Mae Freddie Mac
Estimated Equity
$428,904
Purchase Details
Closed on
Mar 24, 2006
Sold by
Lizakowski Curt
Bought by
Niwot Custom Homes Llc
Home Financials for this Owner
Home Financials are based on the most recent Mortgage that was taken out on this home.
Original Mortgage
$266,400
Outstanding Balance
$155,168
Interest Rate
6.5%
Mortgage Type
Fannie Mae Freddie Mac
Estimated Equity
$428,904
Purchase Details
Closed on
Aug 26, 2004
Sold by
Olando Ltd Liability Co
Bought by
Lizakowski Curt
Create a Home Valuation Report for This Property
The Home Valuation Report is an in-depth analysis detailing your home's value as well as a comparison with similar homes in the area
Home Values in the Area
Average Home Value in this Area
Purchase History
| Date | Buyer | Sale Price | Title Company |
|---|---|---|---|
| Fugate Kristi | $333,000 | None Available | |
| Niwot Custom Homes Llc | $333,000 | None Available | |
| Lizakowski Curt | $62,000 | -- |
Source: Public Records
Mortgage History
| Date | Status | Borrower | Loan Amount |
|---|---|---|---|
| Open | Fugate Kristi | $266,400 |
Source: Public Records
Tax History
| Year | Tax Paid | Tax Assessment Tax Assessment Total Assessment is a certain percentage of the fair market value that is determined by local assessors to be the total taxable value of land and additions on the property. | Land | Improvement |
|---|---|---|---|---|
| 2025 | $3,769 | $38,500 | $7,380 | $31,120 |
| 2024 | $3,769 | $38,500 | $7,380 | $31,120 |
| 2023 | $3,616 | $40,180 | $7,980 | $32,200 |
| 2022 | $3,308 | $31,620 | $5,840 | $25,780 |
| 2021 | $3,341 | $32,540 | $6,010 | $26,530 |
| 2020 | $3,081 | $30,250 | $4,220 | $26,030 |
| 2019 | $3,126 | $30,250 | $4,220 | $26,030 |
| 2018 | $2,684 | $26,950 | $3,600 | $23,350 |
| 2017 | $2,488 | $24,440 | $3,600 | $20,840 |
| 2016 | $2,663 | $25,740 | $2,790 | $22,950 |
| 2015 | $2,582 | $25,740 | $2,790 | $22,950 |
| 2014 | $1,925 | $19,210 | $1,430 | $17,780 |
Source: Public Records
Map
Nearby Homes
- 5870 Summerset Ave
- 5965 Thistle Ridge Ave
- 10818 Cimarron St Unit 1202
- 10818 Cimarron St Unit 1006
- 5870 Scenic Ave
- 6200 Sparrow Ave
- 10529 Taylor Ave
- 10489 Devonshire St
- 6291 Snowberry Ave
- 10516 Sunburst Ave
- 10473 Sunburst Ave
- 5822 Twilight Ave
- 5950 Twilight Ave
- 10289 Dresden St
- 10255 Dresden St
- 10245 Dusk St
- 11205 Coal Ridge St
- 6471 St Vrain Ranch Blvd
- 0 Sable Ave and Colorado Blvd Unit IRE1022922
- 6510 Stagecoach Ave
- 10651 Coal Mine St
- 10631 Coal Mine St
- 10623 Coal Mine St
- 5829 Sunburst Ave
- 10659 Coal Mine St
- 5817 Sunburst Ave
- 5841 Sunburst Ave
- 10611 Coal Mine St
- 5890 Tenderfoot Ave
- 5853 Sunburst Ave
- 10673 Coal Mine St
- 5900 Booth Dr
- 5908 Tenderfoot Ave
- 5816 Sunburst Ave
- 5918 Booth Dr
- 5840 Sunburst Ave
- 5920 Tenderfoot Ave
- 5909 Tenderfoot Ave
- 5893 Booth Dr
- 5881 Booth Dr
Your Personal Tour Guide
Ask me questions while you tour the home.