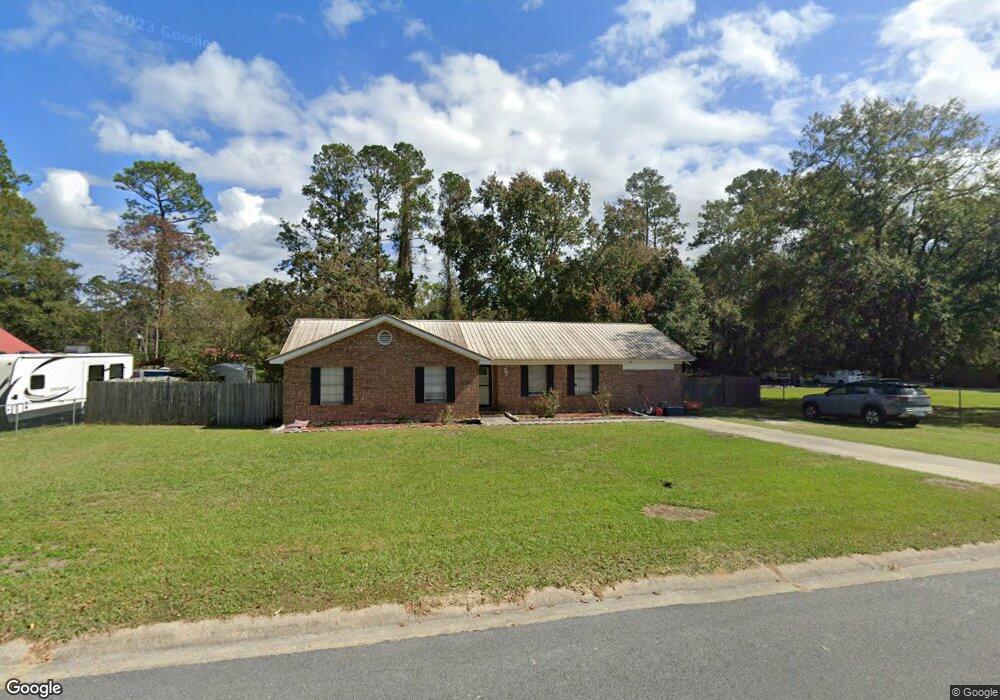
1064 Gobbler Ln Waycross, GA 31503
Estimated Value: $194,903 - $248,000
3
Beds
2
Baths
1,583
Sq Ft
$141/Sq Ft
Est. Value
About This Home
This home is located at 1064 Gobbler Ln, Waycross, GA 31503 and is currently estimated at $223,226, approximately $141 per square foot. 1064 Gobbler Ln is a home located in Ware County with nearby schools including Williams Heights Elementary School, Waycross Middle School, and Ware County High School.
Ownership History
Date
Name
Owned For
Owner Type
Purchase Details
Closed on
Apr 12, 2019
Sold by
Thomas Clayton M
Bought by
Abernathy Jared M and Abernathy Taylor H
Current Estimated Value
Home Financials for this Owner
Home Financials are based on the most recent Mortgage that was taken out on this home.
Original Mortgage
$130,303
Outstanding Balance
$114,560
Interest Rate
4.3%
Mortgage Type
New Conventional
Estimated Equity
$108,667
Purchase Details
Closed on
Aug 27, 2018
Sold by
Hampton John D
Bought by
Thomas Clayton M
Home Financials for this Owner
Home Financials are based on the most recent Mortgage that was taken out on this home.
Original Mortgage
$93,452
Interest Rate
4.5%
Mortgage Type
Commercial
Purchase Details
Closed on
Aug 1, 2003
Sold by
Bryant Bobby D and Bryant Melissa D
Bought by
Hampton John D and Hampton Ann
Purchase Details
Closed on
May 30, 2002
Sold by
Booth Jerry and Booth Sandra
Bought by
Bryant Bobby D and Bryant Melissa D
Purchase Details
Closed on
Feb 5, 1999
Sold by
Tanner Scott and Tanner Tammy
Bought by
Booth Jerry and Booth Sandra
Create a Home Valuation Report for This Property
The Home Valuation Report is an in-depth analysis detailing your home's value as well as a comparison with similar homes in the area
Home Values in the Area
Average Home Value in this Area
Purchase History
| Date | Buyer | Sale Price | Title Company |
|---|---|---|---|
| Abernathy Jared M | $129,000 | -- | |
| Thomas Clayton M | $92,500 | -- | |
| Hampton John D | $87,500 | -- | |
| Bryant Bobby D | $78,000 | -- | |
| Booth Jerry | $66,500 | -- |
Source: Public Records
Mortgage History
| Date | Status | Borrower | Loan Amount |
|---|---|---|---|
| Open | Abernathy Jared M | $130,303 | |
| Previous Owner | Thomas Clayton M | $93,452 |
Source: Public Records
Tax History Compared to Growth
Tax History
| Year | Tax Paid | Tax Assessment Tax Assessment Total Assessment is a certain percentage of the fair market value that is determined by local assessors to be the total taxable value of land and additions on the property. | Land | Improvement |
|---|---|---|---|---|
| 2024 | $994 | $72,047 | $2,812 | $69,235 |
| 2023 | $1,014 | $57,738 | $8,000 | $49,738 |
| 2022 | $1,128 | $57,738 | $8,000 | $49,738 |
| 2021 | $1,175 | $49,666 | $8,000 | $41,666 |
| 2020 | $1,188 | $47,077 | $8,000 | $39,077 |
| 2019 | $1,196 | $39,454 | $8,000 | $31,454 |
| 2018 | $1,063 | $37,968 | $8,000 | $29,968 |
| 2017 | $1,062 | $37,968 | $8,000 | $29,968 |
| 2016 | $1,062 | $37,968 | $8,000 | $29,968 |
| 2015 | $1,072 | $37,968 | $8,000 | $29,968 |
| 2014 | $1,071 | $37,968 | $8,000 | $29,968 |
| 2013 | -- | $37,968 | $8,000 | $29,968 |
Source: Public Records
Map
Nearby Homes
- 1132 Hilltop Rd
- 3817 Central Ave
- 4155 Pinecrest Rd
- 3070 Central Ave
- 1072 Lawhorne Dr
- 630 Saddle Cir
- 606 Stonewall Jackson Place
- 867 Kentland Dr
- 664 Saddle Cir
- 627 Saddle Cir
- 851 Carriage Ln
- 763 Kentland Dr
- 2775 Seminole Trail
- 3153 Southwood Dr
- 1049 Riverdale Dr
- 723 St Bernard Trail
- 955 Lynn Dr
- Tract 4 County-Line Rd S
- 47 +/- Acres Live Oak Ln
- 914 Barkley St
- 1088 Gobbler Ln
- 3595 Wren Dr
- 3492 Lark Ridge
- 1110 Gobbler Ln
- 1012 Gobbler Ln
- 3491 Lark Ridge
- 3483 Wren Dr
- 3482 Lark Ridge
- 1128 Gobbler Ln
- 3492 Wren Dr
- Lot 2 Gobbler Ln
- 3472 Lark Ridge
- 1133 Gobbler Ln
- 3473 Wren Dr
- 1146 Gobbler Ln
- 970 Gobbler Ln
- 1146 Gobbler Ln
- 3474 Wren Dr
- 1132 Hilltop Rd
- 3490 Robin Ridge