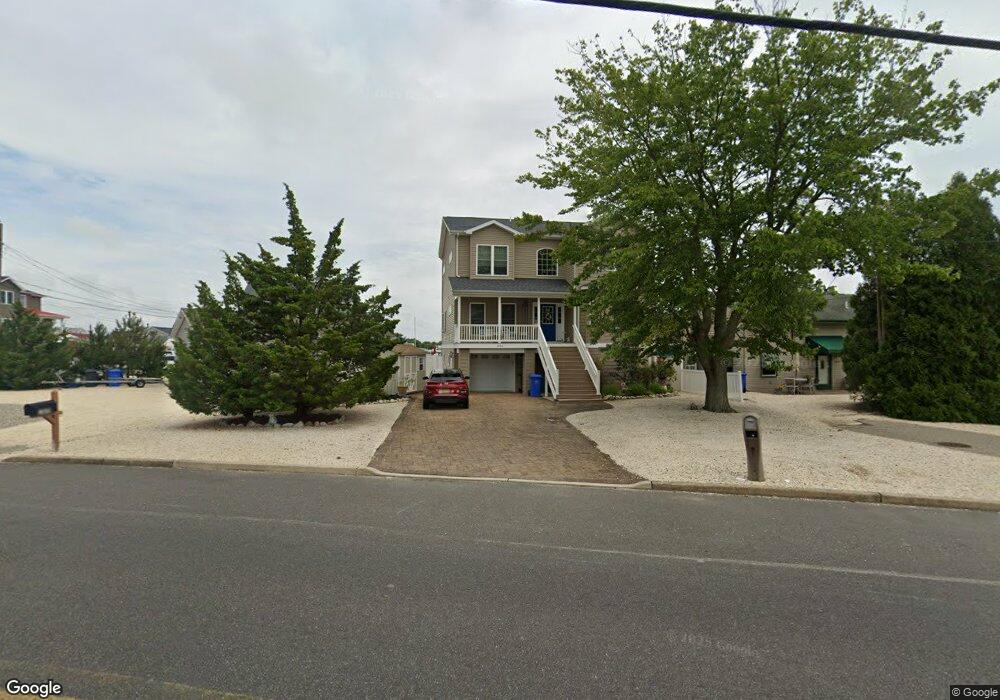
1064 Mill Creek Rd Manahawkin, NJ 08050
Stafford NeighborhoodEstimated Value: $991,000 - $1,224,000
3
Beds
2
Baths
2,263
Sq Ft
$469/Sq Ft
Est. Value
About This Home
This home is located at 1064 Mill Creek Rd, Manahawkin, NJ 08050 and is currently estimated at $1,060,968, approximately $468 per square foot. 1064 Mill Creek Rd is a home located in Ocean County with nearby schools including Oxycocus Elementary School, Ocean Acres Elementary School, and McKinley Avenue Elementary School.
Ownership History
Date
Name
Owned For
Owner Type
Purchase Details
Closed on
Sep 11, 2009
Sold by
Badcock Mark and Smythe Frances
Bought by
Rex Thomas and Cassino Rex Barbara
Current Estimated Value
Purchase Details
Closed on
Oct 25, 2007
Sold by
Collins Meghan K
Bought by
Badcock Mark and Smythe Frances
Home Financials for this Owner
Home Financials are based on the most recent Mortgage that was taken out on this home.
Original Mortgage
$256,000
Interest Rate
6.43%
Mortgage Type
Purchase Money Mortgage
Purchase Details
Closed on
Mar 30, 2007
Sold by
Menna Alfred J and Sottile Jean A
Bought by
Collins Meghan K
Home Financials for this Owner
Home Financials are based on the most recent Mortgage that was taken out on this home.
Original Mortgage
$225,000
Interest Rate
6.25%
Mortgage Type
Purchase Money Mortgage
Purchase Details
Closed on
Mar 22, 2005
Sold by
Estate Of Alfred Menna and Sottile Jean A
Bought by
Sottile Jean A and Menna Alfred J
Create a Home Valuation Report for This Property
The Home Valuation Report is an in-depth analysis detailing your home's value as well as a comparison with similar homes in the area
Home Values in the Area
Average Home Value in this Area
Purchase History
| Date | Buyer | Sale Price | Title Company |
|---|---|---|---|
| Rex Thomas | $335,000 | None Available | |
| Badcock Mark | $320,000 | Commonwealth Land Title Insu | |
| Collins Meghan K | $250,000 | Commonwealth Land Title Insu | |
| Sottile Jean A | -- | -- |
Source: Public Records
Mortgage History
| Date | Status | Borrower | Loan Amount |
|---|---|---|---|
| Previous Owner | Badcock Mark | $256,000 | |
| Previous Owner | Collins Meghan K | $225,000 |
Source: Public Records
Tax History Compared to Growth
Tax History
| Year | Tax Paid | Tax Assessment Tax Assessment Total Assessment is a certain percentage of the fair market value that is determined by local assessors to be the total taxable value of land and additions on the property. | Land | Improvement |
|---|---|---|---|---|
| 2025 | $10,329 | $416,000 | $140,800 | $275,200 |
| 2024 | $9,979 | $416,000 | $140,800 | $275,200 |
| 2023 | $9,543 | $416,000 | $140,800 | $275,200 |
| 2022 | $9,793 | $416,000 | $140,800 | $275,200 |
| 2021 | $9,660 | $416,000 | $140,800 | $275,200 |
| 2020 | $9,614 | $413,500 | $140,800 | $272,700 |
| 2019 | $9,477 | $413,500 | $140,800 | $272,700 |
| 2018 | $9,420 | $413,500 | $140,800 | $272,700 |
| 2017 | $9,146 | $388,700 | $125,800 | $262,900 |
| 2016 | $9,053 | $388,700 | $125,800 | $262,900 |
| 2015 | $8,734 | $130,300 | $125,800 | $4,500 |
| 2014 | $2,967 | $130,400 | $123,600 | $6,800 |
Source: Public Records
Map
Nearby Homes