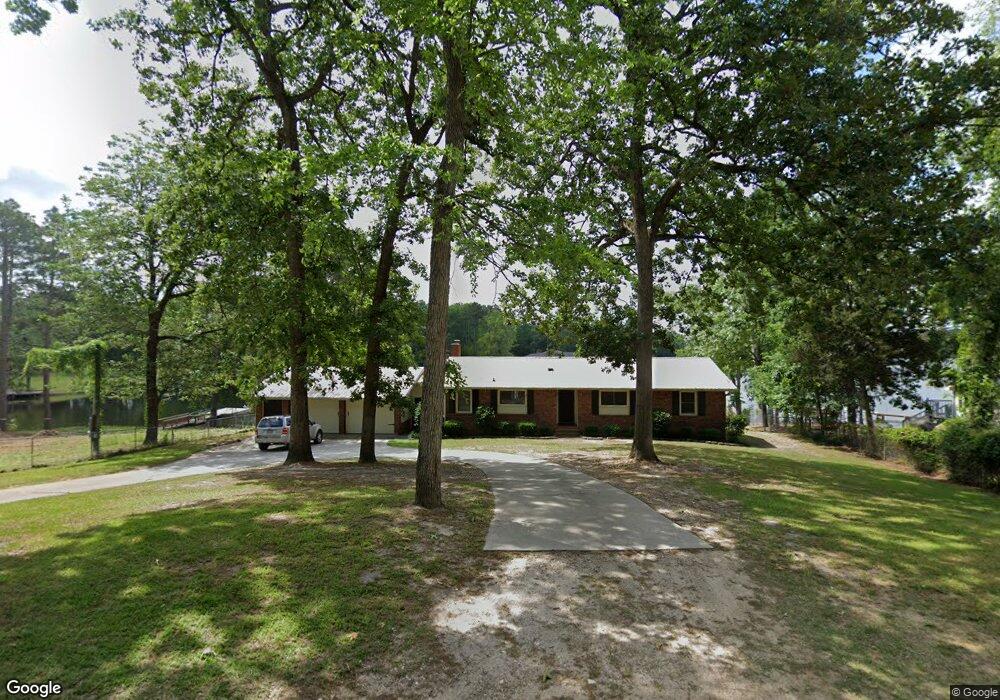
1064 Vansant Rd Leesville, SC 29070
Estimated Value: $585,000 - $722,000
3
Beds
2
Baths
1,700
Sq Ft
$391/Sq Ft
Est. Value
About This Home
This home is located at 1064 Vansant Rd, Leesville, SC 29070 and is currently estimated at $664,354, approximately $390 per square foot. 1064 Vansant Rd is a home located in Lexington County with nearby schools including Batesburg-Leesville Primary School, Batesburg-Leesville Elementary School, and Batesburg-Leesville Middle School.
Ownership History
Date
Name
Owned For
Owner Type
Purchase Details
Closed on
Oct 13, 2021
Sold by
Rikard Nancy E
Bought by
Smith Scott and Smith Lisa Ann
Current Estimated Value
Home Financials for this Owner
Home Financials are based on the most recent Mortgage that was taken out on this home.
Original Mortgage
$450,500
Outstanding Balance
$410,814
Interest Rate
2.8%
Mortgage Type
New Conventional
Estimated Equity
$253,540
Purchase Details
Closed on
Apr 1, 2021
Sold by
Gawith Cassey M and Gawith Kris N
Bought by
Rikard Nancy E
Purchase Details
Closed on
Feb 21, 2017
Sold by
Smoak Robert A
Bought by
Gawith Cassey M and Gawith Kris N
Home Financials for this Owner
Home Financials are based on the most recent Mortgage that was taken out on this home.
Original Mortgage
$346,750
Interest Rate
4.09%
Mortgage Type
New Conventional
Purchase Details
Closed on
Apr 20, 2009
Sold by
Hill Mary C
Bought by
Smoak Robert A
Create a Home Valuation Report for This Property
The Home Valuation Report is an in-depth analysis detailing your home's value as well as a comparison with similar homes in the area
Home Values in the Area
Average Home Value in this Area
Purchase History
| Date | Buyer | Sale Price | Title Company |
|---|---|---|---|
| Smith Scott | $530,000 | Ntc | |
| Rikard Nancy E | -- | None Available | |
| Gawith Cassey M | $365,000 | None Available | |
| Smoak Robert A | $290,000 | -- |
Source: Public Records
Mortgage History
| Date | Status | Borrower | Loan Amount |
|---|---|---|---|
| Open | Smith Scott | $450,500 | |
| Previous Owner | Gawith Cassey M | $346,750 |
Source: Public Records
Tax History Compared to Growth
Tax History
| Year | Tax Paid | Tax Assessment Tax Assessment Total Assessment is a certain percentage of the fair market value that is determined by local assessors to be the total taxable value of land and additions on the property. | Land | Improvement |
|---|---|---|---|---|
| 2024 | $13,913 | $31,800 | $9,600 | $22,200 |
| 2023 | $13,913 | $31,800 | $9,600 | $22,200 |
| 2022 | $13,861 | $31,800 | $9,600 | $22,200 |
| 2020 | $1,860 | $14,600 | $6,400 | $8,200 |
| 2019 | $2,020 | $14,600 | $4,560 | $10,040 |
| 2018 | $1,951 | $14,600 | $4,560 | $10,040 |
| 2017 | $1,080 | $8,778 | $4,560 | $4,218 |
| 2016 | $849 | $8,778 | $4,560 | $4,218 |
| 2014 | $1,182 | $11,598 | $6,080 | $5,518 |
| 2013 | -- | $11,600 | $6,080 | $5,520 |
Source: Public Records
Map
Nearby Homes
- 0 Rock N Creek Rd Unit Lot 3 590102
- 0 Rock N Creek Rd
- 110 Rd
- 0 Langford Rd Unit 612505
- 1160 Carolina Ln
- 141 Thornhill Point
- 1005 Carolina Ln
- 0 Lake Dr Unit 614844
- 158 Saluda Waters Point
- 1694 Wildwood Cove Rd
- 198 Saluda Waters Point
- 1091 Lake Dr
- 000A Rock North Creek Rd
- 116 Mud Pie Dr
- 0 Wildwood Cir Unit 611605
- 920 Wildwood Cir
- 310 Hogan Way
- 127 Saluda Shores Cir
- 10 Newberry Dr
- 406 State Road S-32-1427
- 1068 Vansant Rd
- 1067 Vansant Rd
- 1072 Vansant Rd
- 1050 Vansant Rd
- 1106 Vansant Rd
- 1038 Vansant Rd
- 1018 Asbill Ct
- 1036 Vansant Rd
- 1032 Asbill Ct
- 119 Kalyn Way
- 1046 Asbill Ct
- 1004 Asbill Ct
- 111 Kalyn Way
- 1020 Vansant Rd
- 895 Rock N Creek Rd
- 131 Stone Ridge Rd
- 133 Stone Ridge Rd
- 959 Rock N Creek Rd
- 137 Stone Ridge Rd
- 135 Stone Ridge Rd