Estimated Value: $227,195 - $275,000
3
Beds
2
Baths
1,705
Sq Ft
$146/Sq Ft
Est. Value
About This Home
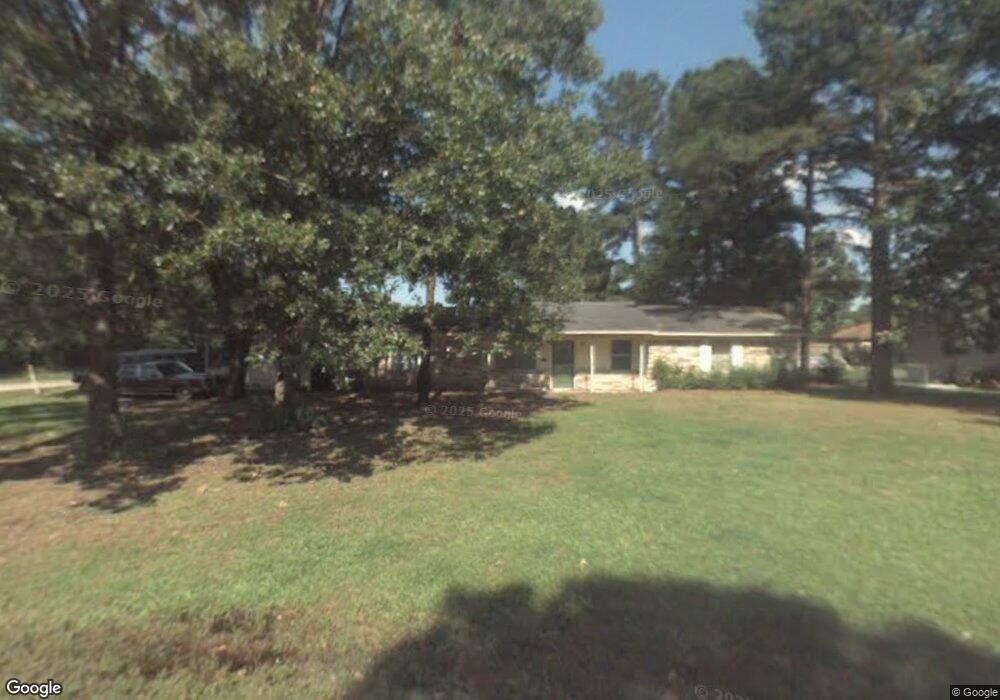
This home is located at 10643 County Road 2250, Tyler, TX 75707 and is currently estimated at $249,049, approximately $146 per square foot. 10643 County Road 2250 is a home located in Smith County with nearby schools including Kissam Intermediate School, Jackson Elementary School, and Chapel Hill Middle School.
Ownership History
Date
Name
Owned For
Owner Type
Purchase Details
Closed on
Feb 5, 2024
Sold by
Joplin Joyce M
Bought by
Ruiz Roy Jose and Ruiz Chandler Cheyenne
Current Estimated Value
Home Financials for this Owner
Home Financials are based on the most recent Mortgage that was taken out on this home.
Original Mortgage
$166,500
Outstanding Balance
$163,230
Interest Rate
6.61%
Mortgage Type
New Conventional
Estimated Equity
$85,819
Purchase Details
Closed on
Feb 2, 2024
Sold by
Joplin Joyce M
Bought by
Ruiz Roy Jose and Ruiz Chandler Cheyenne
Home Financials for this Owner
Home Financials are based on the most recent Mortgage that was taken out on this home.
Original Mortgage
$166,500
Outstanding Balance
$163,230
Interest Rate
6.61%
Mortgage Type
New Conventional
Estimated Equity
$85,819
Purchase Details
Closed on
Mar 9, 2023
Sold by
James L & Joyce M Joplin Revocable Trust
Bought by
Joplin Joyce M
Create a Home Valuation Report for This Property
The Home Valuation Report is an in-depth analysis detailing your home's value as well as a comparison with similar homes in the area
Home Values in the Area
Average Home Value in this Area
Purchase History
| Date | Buyer | Sale Price | Title Company |
|---|---|---|---|
| Ruiz Roy Jose | -- | None Listed On Document | |
| Ruiz Roy Jose | -- | None Listed On Document | |
| Joplin Joyce M | -- | None Listed On Document |
Source: Public Records
Mortgage History
| Date | Status | Borrower | Loan Amount |
|---|---|---|---|
| Open | Ruiz Roy Jose | $166,500 | |
| Closed | Ruiz Roy Jose | $166,500 |
Source: Public Records
Tax History Compared to Growth
Tax History
| Year | Tax Paid | Tax Assessment Tax Assessment Total Assessment is a certain percentage of the fair market value that is determined by local assessors to be the total taxable value of land and additions on the property. | Land | Improvement |
|---|---|---|---|---|
| 2025 | $2,344 | $168,137 | $8,995 | $159,142 |
| 2024 | $2,344 | $189,514 | $28,350 | $161,164 |
| 2023 | $3,351 | $196,203 | $28,350 | $167,853 |
| 2022 | $2,711 | $169,553 | $12,600 | $156,953 |
| 2021 | $2,238 | $131,369 | $12,600 | $118,769 |
| 2020 | $2,319 | $130,608 | $12,600 | $118,008 |
| 2019 | $2,228 | $120,319 | $12,600 | $107,719 |
| 2018 | $2,104 | $114,069 | $12,600 | $101,469 |
| 2017 | $2,146 | $115,721 | $12,600 | $103,121 |
| 2016 | $2,065 | $111,356 | $12,600 | $98,756 |
| 2015 | $1,888 | $107,143 | $12,600 | $94,543 |
| 2014 | $1,888 | $101,520 | $12,600 | $88,920 |
Source: Public Records
Map
Nearby Homes
- 13310 White Tail Dr
- 13311 White Tail Dr
- 13311 White Tail Dr Unit 1
- 13332 White Tail Dr
- 10789 County Road 214
- 10680 County Road 214
- 9961 Creek Bend Dr
- 7789 Lakeshore Dr
- 11452 County Road 2326
- 13807 County Road 220
- 13800 County Road 220
- 13594 State Highway 64 E
- 10788 County Road 225
- 10908 & 10914 County Road 225
- 0000 State Highway 64
- 14951 County Road 2205
- 00 County Road 2209
- 8217 County Road 219
- 8226 County Road 219
- 3515 Chapel View
- 10671 County Road 2250
- 10633 County Road 214
- 10691 County Road 2250
- 10644 County Road 2250
- 10694 County Road 2250
- 10627 County Road 214
- 10719 County Road 2250
- 10712 County Road 2250
- 10683 County Road 2273
- 10726 County Road 2250
- 10638 County Road 214
- 10737 County Road 2250
- 10636 Cr 214
- 10636 County Road 214
- 10636 County Road 214
- 10640 County Road 214
- 10731 County Road 2273
- 10752 County Road 2250
- 10595 Rolling Pines Dr
- 10613 Rolling Pines Dr