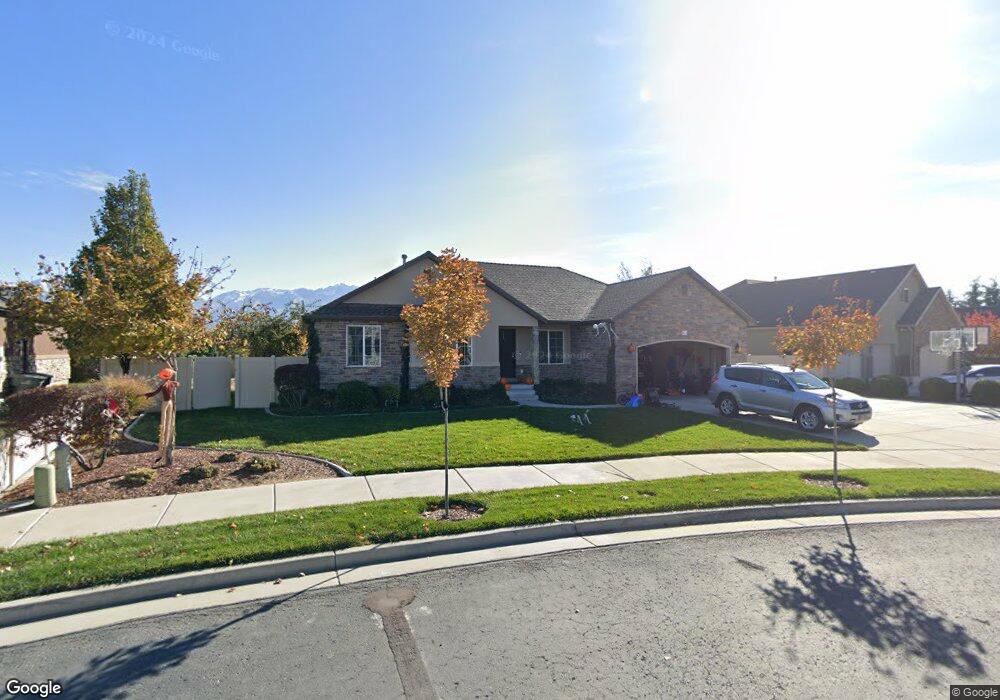
10643 S Winter Haven Ct Unit 6 South Jordan, UT 84095
Estimated Value: $622,000 - $734,000
3
Beds
2
Baths
1,578
Sq Ft
$434/Sq Ft
Est. Value
About This Home
This home is located at 10643 S Winter Haven Ct Unit 6, South Jordan, UT 84095 and is currently estimated at $684,158, approximately $433 per square foot. 10643 S Winter Haven Ct Unit 6 is a home located in Salt Lake County with nearby schools including Monte Vista Elementary School, South Jordan Middle School, and Hawthorn Academy South Jordan.
Ownership History
Date
Name
Owned For
Owner Type
Purchase Details
Closed on
Dec 9, 2009
Sold by
Bishop Homes Llc
Bought by
Karren Clinton C and Karren Samantha M
Current Estimated Value
Home Financials for this Owner
Home Financials are based on the most recent Mortgage that was taken out on this home.
Original Mortgage
$229,779
Outstanding Balance
$150,719
Interest Rate
5.01%
Mortgage Type
FHA
Estimated Equity
$533,439
Purchase Details
Closed on
Sep 3, 2009
Sold by
Bank Of American Fork
Bought by
Bishop Homes Llc
Purchase Details
Closed on
Dec 18, 2008
Sold by
Ht Construction Inc
Bought by
Bank Of American Fork
Purchase Details
Closed on
Oct 10, 2007
Sold by
Ht Construction Inc
Bought by
Moser Farms Llc
Create a Home Valuation Report for This Property
The Home Valuation Report is an in-depth analysis detailing your home's value as well as a comparison with similar homes in the area
Home Values in the Area
Average Home Value in this Area
Purchase History
| Date | Buyer | Sale Price | Title Company |
|---|---|---|---|
| Karren Clinton C | -- | First American Title Ut Co | |
| Bishop Homes Llc | -- | Bonneville Superior Title | |
| Bank Of American Fork | -- | Accommodation | |
| Moser Farms Llc | -- | Accommodation |
Source: Public Records
Mortgage History
| Date | Status | Borrower | Loan Amount |
|---|---|---|---|
| Open | Karren Clinton C | $229,779 | |
| Closed | Bishop Homes Llc | $0 |
Source: Public Records
Tax History Compared to Growth
Tax History
| Year | Tax Paid | Tax Assessment Tax Assessment Total Assessment is a certain percentage of the fair market value that is determined by local assessors to be the total taxable value of land and additions on the property. | Land | Improvement |
|---|---|---|---|---|
| 2025 | $3,429 | $674,000 | $282,300 | $391,700 |
| 2024 | $3,429 | $651,000 | $274,200 | $376,800 |
| 2023 | $3,469 | $621,500 | $268,900 | $352,600 |
| 2022 | $3,677 | $645,700 | $263,600 | $382,100 |
| 2021 | $2,964 | $477,500 | $223,500 | $254,000 |
| 2020 | $2,789 | $421,200 | $222,300 | $198,900 |
| 2019 | $2,774 | $411,800 | $218,900 | $192,900 |
| 2018 | $2,603 | $384,500 | $145,900 | $238,600 |
| 2017 | $2,072 | $361,300 | $145,900 | $215,400 |
| 2016 | $2,559 | $334,900 | $145,900 | $189,000 |
| 2015 | $2,559 | $341,200 | $167,100 | $174,100 |
| 2014 | $2,414 | $316,400 | $156,300 | $160,100 |
Source: Public Records
Map
Nearby Homes
- 481 W Haven Hill Way S Unit 9
- 1097 W Kings Landing Ct Unit 1
- 11302 S Haven Willow Way W
- 11316 S Haven Willow Way W Unit 5
- 1096 W Kings Landing Ct Unit 2
- 9584 S Ember Glow Ct W Unit D
- 1085 W Kings Landing Ct S Unit 6
- 9566 S Ember Glow Ct Unit D
- 9553 S Ember Glow Ct Unit D
- 524 W Haven Hill Way S Unit 3
- 9584 S Ember Glow Ct Unit C
- 9822 S South Temple Dr W
- 11328 S Haven Willow Way W Unit 6
- 1071 W Kings Landing Ct Unit 5
- 10596 S Pinyon Pines Ct
- 1581 Wyngate Park Dr
- 10831 S Wynview Ln
- 1469 Old Cyprus Ct
- 10804 S Haven Landing Dr
- 10838 S Haven Landing Dr
- 10657 Winter Haven Ct
- 10671 Winter Haven Ct
- 10657 S Winter Haven Ct Unit 5
- 10627 S Winter Haven Ct Unit 7
- 10643 Winter Haven Ct
- 10627 Winter Haven Ct
- 10632 S Redwood Rd
- 10658 Winter Haven Ct
- 1809 W 10610 S
- 10671 S Winter Haven Ct Unit 4
- 10658 S Winter Haven Ct Unit 2
- 10672 S Winter Haven Ct
- 10672 S Winter Haven Ct Unit 3
- 1774 W 10740 S
- 1833 W 10610 S
- 1802 W 10740 S
- 1808 W 10610 S Unit 222
- 1748 W 10740 S Unit 124
- 1748 W 10740 S
- 10701 S 1865 W