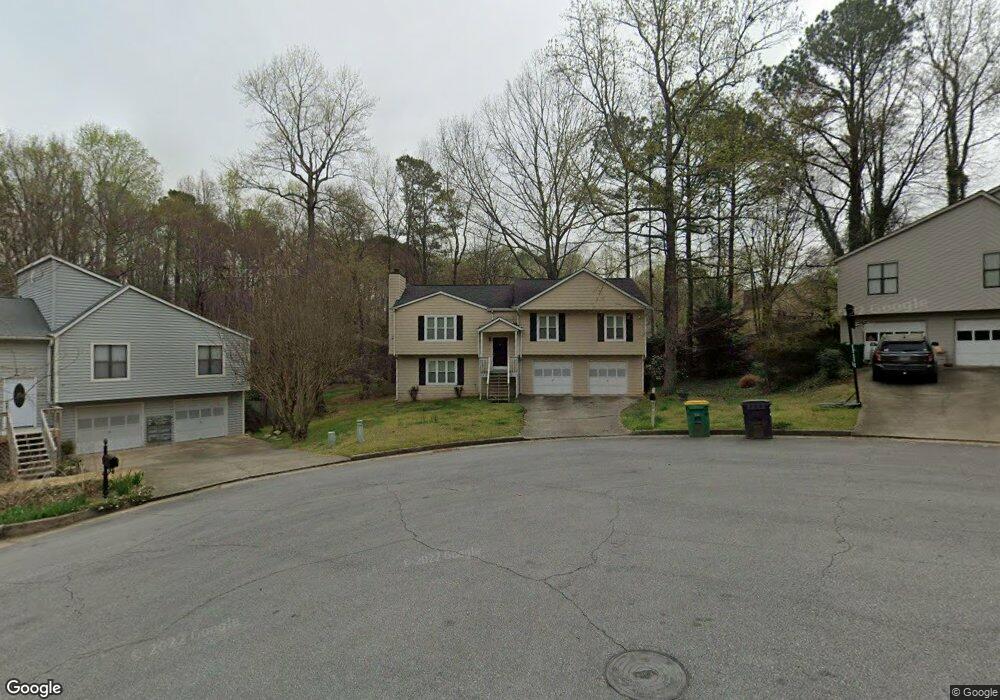
10645 Colony Glen Dr Unit 3 Alpharetta, GA 30022
Estimated Value: $448,000 - $479,000
3
Beds
4
Baths
1,385
Sq Ft
$332/Sq Ft
Est. Value
About This Home
This home is located at 10645 Colony Glen Dr Unit 3, Alpharetta, GA 30022 and is currently estimated at $460,407, approximately $332 per square foot. 10645 Colony Glen Dr Unit 3 is a home located in Fulton County with nearby schools including Dolvin Elementary School, Autrey Mill Middle School, and Johns Creek High School.
Ownership History
Date
Name
Owned For
Owner Type
Purchase Details
Closed on
Oct 24, 2017
Sold by
Sby 2014 1 Borrower Llc
Bought by
Tah Ms Borrower Llc
Current Estimated Value
Purchase Details
Closed on
Aug 12, 2014
Sold by
2012 C Property Holdings Llc
Bought by
Sby 2014 1 Borrower Llc
Purchase Details
Closed on
Nov 6, 2012
Sold by
Foster Sebastian
Bought by
2012 C Property Holdings Llc
Purchase Details
Closed on
Oct 3, 1996
Sold by
Kunitz Beartrix C
Bought by
Foster Sebastian
Purchase Details
Closed on
Sep 10, 1993
Sold by
Donati John F Mary A
Bought by
Kunitz Beatrix C
Home Financials for this Owner
Home Financials are based on the most recent Mortgage that was taken out on this home.
Original Mortgage
$68,700
Interest Rate
7.19%
Create a Home Valuation Report for This Property
The Home Valuation Report is an in-depth analysis detailing your home's value as well as a comparison with similar homes in the area
Home Values in the Area
Average Home Value in this Area
Purchase History
| Date | Buyer | Sale Price | Title Company |
|---|---|---|---|
| Tah Ms Borrower Llc | -- | -- | |
| Sby 2014 1 Borrower Llc | -- | -- | |
| 2012 C Property Holdings Llc | $103,211 | -- | |
| Foster Sebastian | $110,000 | -- | |
| Kunitz Beatrix C | $91,700 | -- |
Source: Public Records
Mortgage History
| Date | Status | Borrower | Loan Amount |
|---|---|---|---|
| Previous Owner | Kunitz Beatrix C | $68,700 | |
| Closed | Foster Sebastian | $0 |
Source: Public Records
Tax History Compared to Growth
Tax History
| Year | Tax Paid | Tax Assessment Tax Assessment Total Assessment is a certain percentage of the fair market value that is determined by local assessors to be the total taxable value of land and additions on the property. | Land | Improvement |
|---|---|---|---|---|
| 2025 | $5,875 | $191,200 | $40,520 | $150,680 |
| 2023 | $5,170 | $183,160 | $34,760 | $148,400 |
| 2022 | $3,086 | $100,560 | $19,080 | $81,480 |
| 2021 | $3,168 | $100,560 | $19,080 | $81,480 |
| 2020 | $2,752 | $100,560 | $19,080 | $81,480 |
| 2019 | $390 | $98,800 | $18,760 | $80,040 |
| 2018 | $2,764 | $84,880 | $17,600 | $67,280 |
| 2017 | $1,956 | $57,480 | $15,160 | $42,320 |
| 2016 | $1,928 | $57,480 | $15,160 | $42,320 |
| 2015 | $1,949 | $57,480 | $15,160 | $42,320 |
| 2014 | $1,739 | $49,320 | $9,720 | $39,600 |
Source: Public Records
Map
Nearby Homes
- 710 Country Manor Way
- 10515 Colony Glen Dr Unit 2
- 130 Colony Run
- 10530 Tuxford Dr
- 285 Rolling Mist Ct
- 10415 Plantation Bridge Dr
- 11070 Pinewalk Forest Cir
- 125 Oak Bridge Ct Unit 2
- 10880 Windham Way
- 10325 Oxford Mill Cir Unit 1
- 120 Thome Dr
- 105 Kimball Bridge Cove
- 125 Sandridge Ct
- 465 Kirkstall Trail
- 345 Kincardine Way Unit IIIA
- 4465 Hawthorn Cir
- 3962 Erin Dr
- 4090 Brooks Bridge Crossing
- 10680 Colony Glen Dr
- 10635 Colony Glen Dr
- 4080 Brooks Bridge Crossing Unit 3
- 10625 Colony Glen Dr
- 4135 Brooks Bridge Crossing
- 10670 Colony Glen Dr
- 10660 Colony Glen Dr
- 4070 Brooks Bridge Crossing
- 10615 Colony Glen Dr
- 4125 Brooks Bridge Crossing
- 10650 Colony Glen Dr
- 10620 Colony Glen Dr
- 10630 Colony Glen Dr
- 10630 Colony Glen Dr Unit 93
- 745 Country Manor Way
- 10640 Colony Glen Dr
- 4060 Brooks Bridge Crossing
- 10610 Colony Glen Dr
- 10605 Colony Glen Dr Unit 3