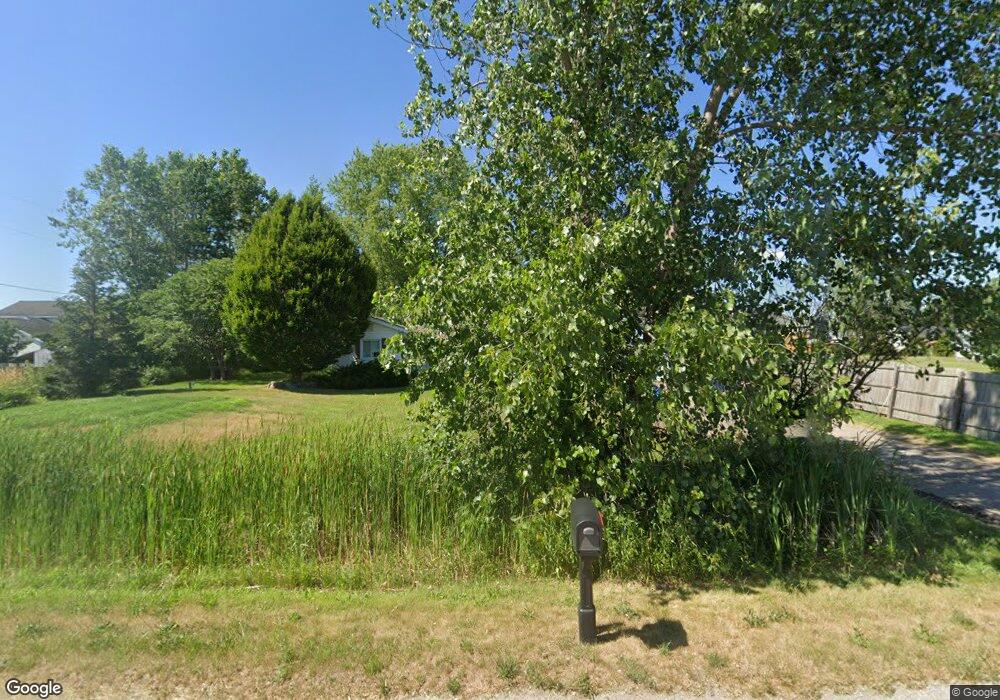
1065 142nd Ave Wayland, MI 49348
Estimated Value: $288,761 - $312,000
3
Beds
1
Bath
1,250
Sq Ft
$242/Sq Ft
Est. Value
About This Home
This home is located at 1065 142nd Ave, Wayland, MI 49348 and is currently estimated at $302,690, approximately $242 per square foot. 1065 142nd Ave is a home located in Allegan County with nearby schools including Wayland High School, Moline Christian School, and St. Therese Catholic School.
Ownership History
Date
Name
Owned For
Owner Type
Purchase Details
Closed on
Jun 29, 2016
Sold by
Mingerink Brian J and Mingerink Bree N
Bought by
Marcus Rickey L
Current Estimated Value
Home Financials for this Owner
Home Financials are based on the most recent Mortgage that was taken out on this home.
Original Mortgage
$128,534
Outstanding Balance
$102,543
Interest Rate
3.56%
Mortgage Type
New Conventional
Estimated Equity
$200,147
Purchase Details
Closed on
Feb 13, 2013
Sold by
Morren & Associates Llc
Bought by
Moline Land Company Llc
Purchase Details
Closed on
Mar 20, 2003
Sold by
Ingersoll Jeremy S and Ingersoll Jamie L
Bought by
Mingerink Brian J and Mingerink Bree N
Home Financials for this Owner
Home Financials are based on the most recent Mortgage that was taken out on this home.
Original Mortgage
$109,250
Interest Rate
5.71%
Mortgage Type
FHA
Purchase Details
Closed on
Oct 12, 1998
Sold by
Allen Howard J
Bought by
Ingersoll Jeremy S and Ingersoll Jamie L
Purchase Details
Closed on
Aug 20, 1998
Sold by
Allen Howard J
Bought by
Union Federal Savings Bank
Create a Home Valuation Report for This Property
The Home Valuation Report is an in-depth analysis detailing your home's value as well as a comparison with similar homes in the area
Home Values in the Area
Average Home Value in this Area
Purchase History
| Date | Buyer | Sale Price | Title Company |
|---|---|---|---|
| Marcus Rickey L | $125,000 | Chicago Title | |
| Moline Land Company Llc | -- | None Available | |
| Mingerink Brian J | $111,000 | Chicago Title | |
| Ingersoll Jeremy S | $75,000 | -- | |
| Union Federal Savings Bank | $62,400 | -- |
Source: Public Records
Mortgage History
| Date | Status | Borrower | Loan Amount |
|---|---|---|---|
| Open | Marcus Rickey L | $128,534 | |
| Previous Owner | Mingerink Brian J | $109,250 |
Source: Public Records
Tax History Compared to Growth
Tax History
| Year | Tax Paid | Tax Assessment Tax Assessment Total Assessment is a certain percentage of the fair market value that is determined by local assessors to be the total taxable value of land and additions on the property. | Land | Improvement |
|---|---|---|---|---|
| 2025 | $2,528 | $111,200 | $13,700 | $97,500 |
| 2024 | $2,320 | $109,500 | $13,200 | $96,300 |
| 2023 | $2,320 | $95,600 | $13,200 | $82,400 |
| 2022 | $2,320 | $84,100 | $13,200 | $70,900 |
| 2021 | $2,146 | $81,000 | $14,500 | $66,500 |
| 2020 | $2,122 | $76,600 | $14,500 | $62,100 |
| 2019 | $2,060 | $69,700 | $14,300 | $55,400 |
| 2018 | $1,985 | $68,400 | $14,300 | $54,100 |
| 2017 | $0 | $70,800 | $14,300 | $0 |
| 2016 | $0 | $55,500 | $14,300 | $41,200 |
| 2015 | -- | $55,500 | $14,300 | $41,200 |
| 2014 | -- | $51,800 | $14,300 | $37,500 |
| 2013 | $1,632 | $49,000 | $14,300 | $34,700 |
Source: Public Records
Map
Nearby Homes
- 4240 Butternut Dr
- Vienna Plan at Harvest Meadows
- Charlotte Plan at Harvest Meadows
- Sierra Plan at Harvest Meadows
- Karolynn Plan at Harvest Meadows
- Reno Plan at Harvest Meadows
- Bayberry Plan at Harvest Meadows
- Freedom Plan at Harvest Meadows
- London Plan at Harvest Meadows
- Hampton Plan at Harvest Meadows
- Oxford Plan at Harvest Meadows
- 4243 Butternut Dr
- 4245 Butternut Dr
- 4249 Butternut Dr
- Lot 142 Butternut Dr
- Lot 141 Butternut Dr
- 4274 Butternut Dr
- Unit 111 Highpoint Dr
- 4273 Highpoint Dr Unit 112
- 4316 Sussex Place
- 4201 Homestead
- Lot 102
- 4205 Homestead
- 1061 142nd Ave
- Lot 114 Harvest Meadows
- 4209 Homestead
- 4213 Homestead
- 4213 Butternut Dr
- 4202 Homestead
- 4217 Homestead
- 4210 Homestead
- 1055 142nd Ave
- 4221 Homestead
- 4214 Homestead
- 4206 Homestead
- 1070 Barnwood
- 1060 Barnwood Dr
- Lot 84 Barnwood Dr
- Lot 83 Barnwood Dr
- 1072 Barnwood