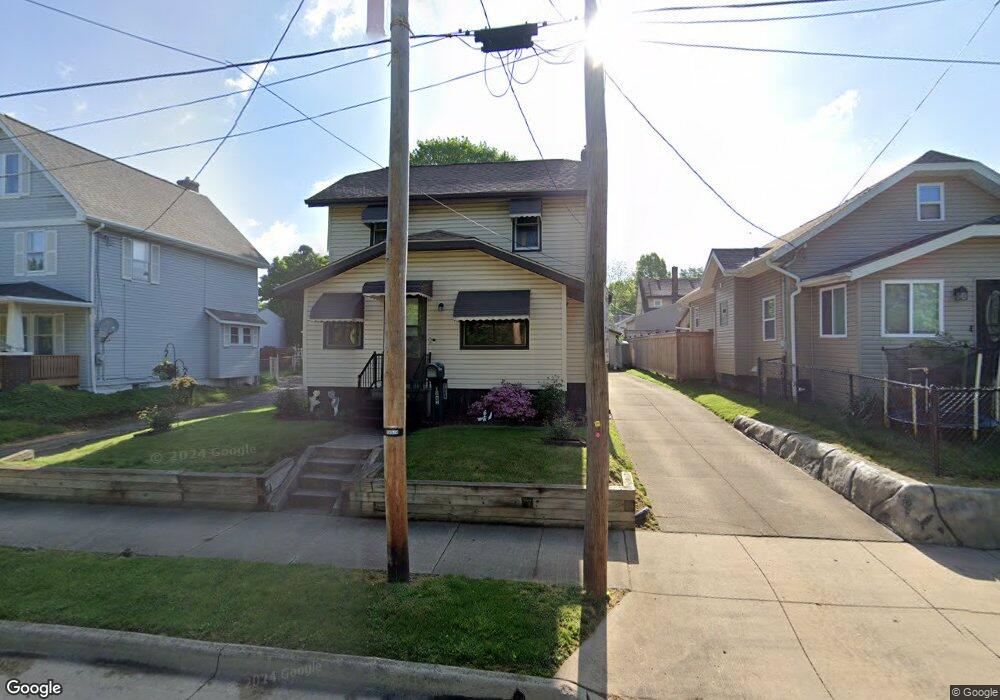
1065 Coventry St Akron, OH 44306
East Akron NeighborhoodEstimated Value: $70,000 - $103,000
3
Beds
1
Bath
984
Sq Ft
$87/Sq Ft
Est. Value
About This Home
This home is located at 1065 Coventry St, Akron, OH 44306 and is currently estimated at $85,693, approximately $87 per square foot. 1065 Coventry St is a home located in Summit County with nearby schools including Glover Community Learning Center, Kenmore Garfield Community Learning Center, and Main Preparatory Academy.
Ownership History
Date
Name
Owned For
Owner Type
Purchase Details
Closed on
Dec 1, 2017
Sold by
Fridley Bobby E
Bought by
Fridley Keith E and Fridley Bobby E
Current Estimated Value
Purchase Details
Closed on
Apr 20, 2005
Sold by
Estate Of Robert L Bender Sr
Bought by
Bender Stephen H and Bender Randall W
Purchase Details
Closed on
Feb 13, 2004
Sold by
Ludwig Desirea M and Ludwig Matthew
Bought by
Bender Larry F
Purchase Details
Closed on
Dec 4, 2003
Sold by
Shreve Kathy
Bought by
Bender Larry F
Purchase Details
Closed on
Dec 2, 2003
Sold by
Bender Stephen H
Bought by
Bender Larry F
Purchase Details
Closed on
Nov 23, 2003
Sold by
Whitt Beverly I and Whitt James
Bought by
Bender Larry F
Purchase Details
Closed on
Nov 22, 2003
Sold by
Bender Randall W and Bender Elizabeth
Bought by
Bender Larry F
Purchase Details
Closed on
Aug 14, 2003
Sold by
Estate Of Frances V Bender
Bought by
Bender Robert L
Create a Home Valuation Report for This Property
The Home Valuation Report is an in-depth analysis detailing your home's value as well as a comparison with similar homes in the area
Home Values in the Area
Average Home Value in this Area
Purchase History
| Date | Buyer | Sale Price | Title Company |
|---|---|---|---|
| Fridley Keith E | -- | None Available | |
| Bender Stephen H | -- | -- | |
| Bender Larry F | -- | -- | |
| Bender Larry F | -- | -- | |
| Bender Larry F | -- | -- | |
| Bender Larry F | -- | -- | |
| Bender Larry F | -- | -- | |
| Bender Larry F | -- | -- | |
| Bender Larry F | -- | -- | |
| Bender Robert L | -- | -- |
Source: Public Records
Tax History Compared to Growth
Tax History
| Year | Tax Paid | Tax Assessment Tax Assessment Total Assessment is a certain percentage of the fair market value that is determined by local assessors to be the total taxable value of land and additions on the property. | Land | Improvement |
|---|---|---|---|---|
| 2025 | $2,823 | $16,786 | $3,724 | $13,062 |
| 2024 | $1,008 | $16,786 | $3,724 | $13,062 |
| 2023 | $2,823 | $16,786 | $3,724 | $13,062 |
| 2022 | $747 | $10,199 | $2,191 | $8,008 |
| 2021 | $748 | $10,199 | $2,191 | $8,008 |
| 2020 | $737 | $10,200 | $2,190 | $8,010 |
| 2019 | $847 | $10,820 | $3,080 | $7,740 |
| 2018 | $836 | $10,820 | $3,080 | $7,740 |
| 2017 | $1,083 | $10,820 | $3,080 | $7,740 |
| 2016 | $1,084 | $13,060 | $3,690 | $9,370 |
| 2015 | $1,083 | $13,060 | $3,690 | $9,370 |
| 2014 | $1,076 | $13,060 | $3,690 | $9,370 |
| 2013 | $1,174 | $14,740 | $3,690 | $11,050 |
Source: Public Records
Map
Nearby Homes
- 1043 Coventry St
- 970 Allendale Ave
- 1040 Allendale Ave
- 986 Hammel St
- 920 Rowe St
- 979 Neptune Ave
- 1118 Neptune Ave
- 1094 Dietz Ave
- 1102 Dietz Ave
- 1198 Burkhardt Ave
- 1185 Herberich Ave
- 1051 Brown St
- 559 Morgan Ave
- 1230 Herberich Ave
- 1124 Hammel St
- 1243 Herberich Ave
- 1217 Brown St
- 823 Merton Ave
- 877 Bertha Ave
- 1263 Herberich Ave
- 1061 Coventry St
- 1069 Coventry St
- 1073 Coventry St
- 1055 Coventry St
- 996 Allendale Ave
- 1000 Allendale Ave
- 990 Allendale Ave
- 1051 Coventry St
- 1077 Coventry St
- 1004 Allendale Ave
- 986 Allendale Ave
- 982 Allendale Ave
- 1008 Allendale Ave
- 0 Allendale Ave 982
- 1047 Coventry St
- 978 Allendale Ave
- 674 Cole Ave
- 974 Allendale Ave
- 680 Cole Ave
- 668 Cole Ave