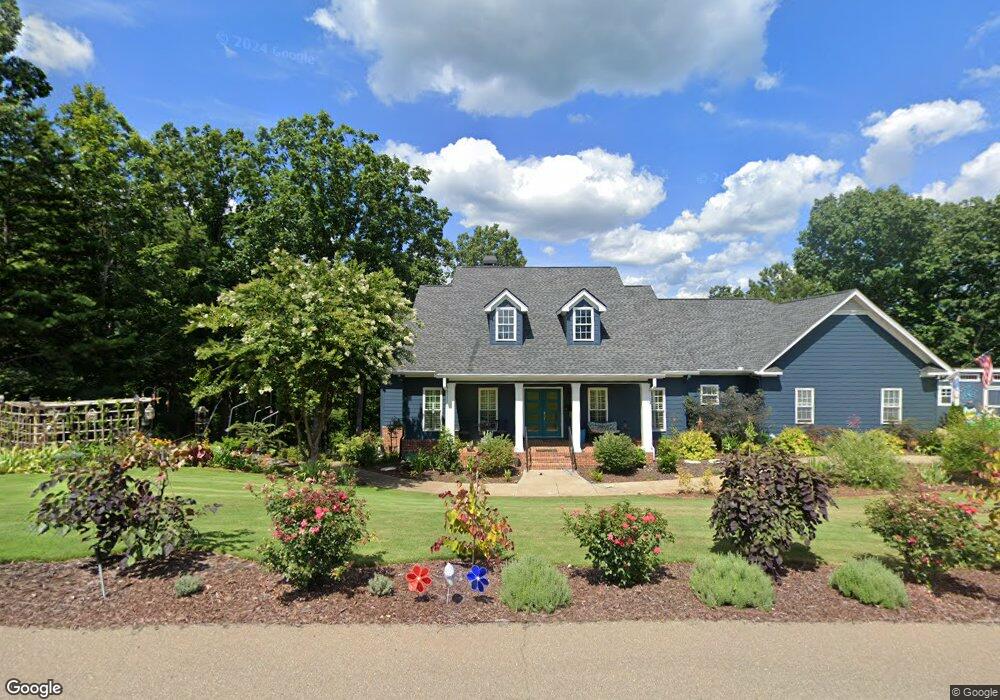
1065 Hunters Ridge Jasper, GA 30143
Big Canoe NeighborhoodEstimated Value: $688,000 - $791,000
--
Bed
5
Baths
2,166
Sq Ft
$337/Sq Ft
Est. Value
About This Home
This home is located at 1065 Hunters Ridge, Jasper, GA 30143 and is currently estimated at $730,178, approximately $337 per square foot. 1065 Hunters Ridge is a home located in Pickens County with nearby schools including Tate Elementary School, Pickens County Middle School, and Pickens County High School.
Ownership History
Date
Name
Owned For
Owner Type
Purchase Details
Closed on
Oct 28, 2024
Sold by
Morris Kenneth R
Bought by
Oneill Mary L and Oneill Robert B
Current Estimated Value
Purchase Details
Closed on
Oct 25, 2013
Sold by
Hunter Marjorie S
Bought by
Morris Kenneth R
Purchase Details
Closed on
Mar 1, 1999
Sold by
Haley Marc S and Haley Debra
Bought by
Hunter Jerry R
Purchase Details
Closed on
Oct 23, 1996
Sold by
Ahern Larry and Ahern Janice
Bought by
Haley Marc S and Haley Debra
Purchase Details
Closed on
Nov 3, 1992
Sold by
Knighton Christopher and Knighton Shirley
Bought by
Ahern Larry and Ahern Janice
Purchase Details
Closed on
Oct 1, 1988
Sold by
Davidson James E and La June
Bought by
Knighton Christopher and Knighton Shirley
Purchase Details
Closed on
Jan 1, 1988
Sold by
Big Canoe
Bought by
Davidson James E and La June
Create a Home Valuation Report for This Property
The Home Valuation Report is an in-depth analysis detailing your home's value as well as a comparison with similar homes in the area
Home Values in the Area
Average Home Value in this Area
Purchase History
| Date | Buyer | Sale Price | Title Company |
|---|---|---|---|
| Oneill Mary L | $700,000 | -- | |
| Morris Kenneth R | $255,000 | -- | |
| Hunter Jerry R | $20,000 | -- | |
| Haley Marc S | $18,000 | -- | |
| Ahern Larry | $12,200 | -- | |
| Knighton Christopher | -- | -- | |
| Davidson James E | -- | -- |
Source: Public Records
Tax History Compared to Growth
Tax History
| Year | Tax Paid | Tax Assessment Tax Assessment Total Assessment is a certain percentage of the fair market value that is determined by local assessors to be the total taxable value of land and additions on the property. | Land | Improvement |
|---|---|---|---|---|
| 2024 | $2,692 | $136,014 | $30,000 | $106,014 |
| 2023 | $2,766 | $136,014 | $30,000 | $106,014 |
| 2022 | $2,766 | $136,014 | $30,000 | $106,014 |
| 2021 | $2,964 | $136,014 | $30,000 | $106,014 |
| 2020 | $3,053 | $136,014 | $30,000 | $106,014 |
| 2019 | $3,123 | $136,014 | $30,000 | $106,014 |
| 2018 | $3,152 | $136,014 | $30,000 | $106,014 |
| 2017 | $3,204 | $136,014 | $30,000 | $106,014 |
| 2016 | $3,255 | $136,014 | $30,000 | $106,014 |
| 2015 | $3,179 | $136,014 | $30,000 | $106,014 |
| 2014 | $2,389 | $79,500 | $22,500 | $79,500 |
| 2013 | -- | $136,013 | $30,000 | $106,013 |
Source: Public Records
Map
Nearby Homes
- 60 Cove Lake Dr
- 9317 Blackwell Creek Way
- 43 Morgan Walk
- 374 Shetland Trace
- 101 Twin Creeks Dr
- 1363 Cox Mountain Dr
- 8261 Cox Mountain Dr
- 8242 Cox Mountain Dr
- 916 Cove Lake Dr
- 24 Kane Dr
- 807 Choctaw Pass
- 817 Choctaw Pass
- 8259 Cox Mountain Dr
- 1944 Wilderness Parkway 562
- 8271 Cox Mountain Ln
- 30 Villa Vista
- 212 Chestnut Rise
- 2559 Wilderness Pkwy
- 0 Highway 53 E Unit 7635463
- 42 Villa Vista
- 1089 Hunters Trace
- 1089 Hunters Ridge
- 9036 Hunters Trace
- 9046 Hunters Trace
- 9008 Hunters Trace
- 1067 Hunters Trace
- 1109 Hunters Ridge
- 1090 Hunters Trace
- 1080 Hunters Ridge
- 1027 Hunters Ridge
- 1027 Hunters Trace
- 1108 Hunters Ridge
- 1036 Hunters Trace
- 66 Pony Ln
- 1058 Hunters Ridge
- 997 Hunters Ridge Unit 9036
- 997 Hunters Ridge
- 997 Hunters Trace
- 1008 Hunters Ridge
- 9025 Pony Ln