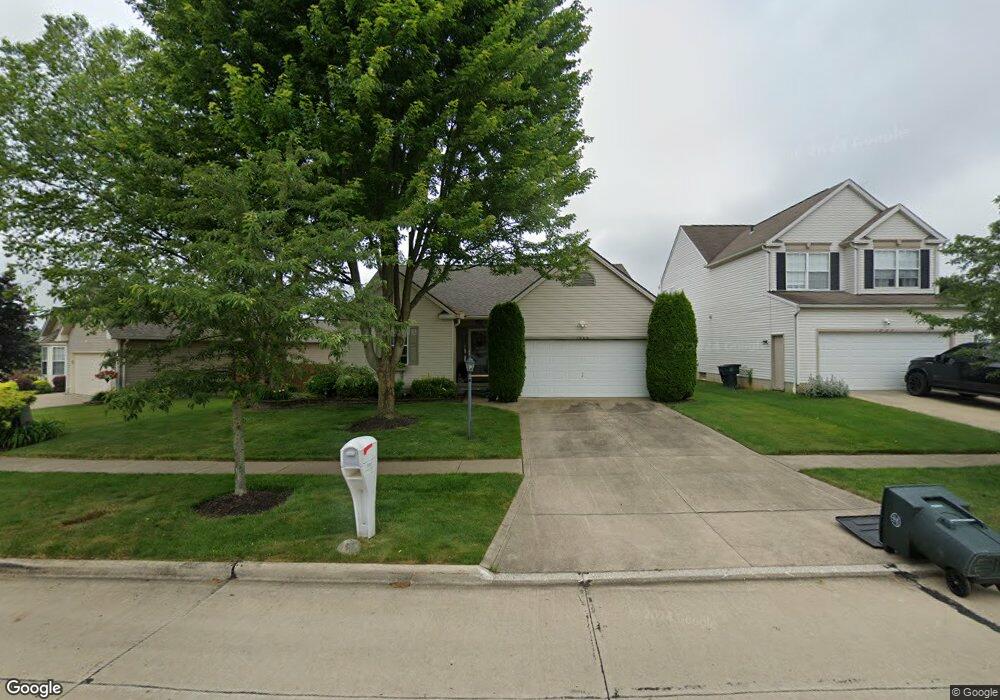
1065 Ledgestone Dr Wadsworth, OH 44281
Estimated Value: $291,155 - $343,000
3
Beds
2
Baths
1,338
Sq Ft
$239/Sq Ft
Est. Value
About This Home
This home is located at 1065 Ledgestone Dr, Wadsworth, OH 44281 and is currently estimated at $319,789, approximately $239 per square foot. 1065 Ledgestone Dr is a home located in Medina County with nearby schools including Valley View Elementary School, Central Intermediate School, and Wadsworth Middle School.
Ownership History
Date
Name
Owned For
Owner Type
Purchase Details
Closed on
Jul 27, 2010
Sold by
Morehead Timothy W and Morehead Roxanne
Bought by
Morehead Roxanne
Current Estimated Value
Purchase Details
Closed on
Jul 28, 2009
Sold by
Rogers Christopher J
Bought by
Morehead Timothy W
Purchase Details
Closed on
Dec 3, 2001
Sold by
Unmistakably Premier Homes Inc
Bought by
Rogers Christopher J
Home Financials for this Owner
Home Financials are based on the most recent Mortgage that was taken out on this home.
Original Mortgage
$133,450
Interest Rate
6.64%
Purchase Details
Closed on
Sep 14, 2001
Sold by
Wadsworth Ltd Liability Company
Bought by
Unmistakably Premier Homes Inc
Home Financials for this Owner
Home Financials are based on the most recent Mortgage that was taken out on this home.
Original Mortgage
$116,250
Interest Rate
7.03%
Create a Home Valuation Report for This Property
The Home Valuation Report is an in-depth analysis detailing your home's value as well as a comparison with similar homes in the area
Home Values in the Area
Average Home Value in this Area
Purchase History
| Date | Buyer | Sale Price | Title Company |
|---|---|---|---|
| Morehead Roxanne | -- | -- | |
| Morehead Timothy W | $151,000 | -- | |
| Rogers Christopher J | $157,200 | -- | |
| Unmistakably Premier Homes Inc | $34,000 | -- |
Source: Public Records
Mortgage History
| Date | Status | Borrower | Loan Amount |
|---|---|---|---|
| Previous Owner | Rogers Christopher J | $133,450 | |
| Previous Owner | Unmistakably Premier Homes Inc | $116,250 |
Source: Public Records
Tax History Compared to Growth
Tax History
| Year | Tax Paid | Tax Assessment Tax Assessment Total Assessment is a certain percentage of the fair market value that is determined by local assessors to be the total taxable value of land and additions on the property. | Land | Improvement |
|---|---|---|---|---|
| 2024 | $2,868 | $75,080 | $19,690 | $55,390 |
| 2023 | $2,868 | $75,080 | $19,690 | $55,390 |
| 2022 | $2,933 | $75,080 | $19,690 | $55,390 |
| 2021 | $2,671 | $60,060 | $15,750 | $44,310 |
| 2020 | $2,352 | $60,060 | $15,750 | $44,310 |
| 2019 | $2,355 | $60,060 | $15,750 | $44,310 |
| 2018 | $2,210 | $53,890 | $14,370 | $39,520 |
| 2017 | $2,210 | $53,890 | $14,370 | $39,520 |
| 2016 | $2,247 | $53,890 | $14,370 | $39,520 |
| 2015 | $2,580 | $49,440 | $13,180 | $36,260 |
| 2014 | $2,623 | $49,440 | $13,180 | $36,260 |
| 2013 | $2,626 | $49,440 | $13,180 | $36,260 |
Source: Public Records
Map
Nearby Homes
- 1031 Ledgestone Dr
- 354 Edenmore St
- 1570 Reimer Rd
- 563 Rockglen Dr
- 1384 Tullamore Trail
- 1414 Tullamore Trail
- 1396 Tullamore Trail
- Amberwood Plan at Highlands of Sharon
- Westchester Plan at Highlands of Sharon
- Hilltop Plan at Highlands of Sharon
- Riverton Plan at Highlands of Sharon
- Greenfield Plan at Highlands of Sharon
- 1400 Harmony Dr
- 4896 Ridge Rd
- 1397 Harmony Dr
- 996 Rosemarie Cir
- 8243 Leatherman Rd
- 328 Deepwood Dr Unit 328
- 189 Park Place Dr Unit 122
- 271 Park Place Dr Unit 83
- 1057 Ledgestone Dr
- 1073 Ledgestone Dr
- 1051 Ledgestone Dr
- 1079 Ledgestone Dr
- 1062 Ledgestone Dr
- 1068 Ledgestone Dr
- 1058 Ledgestone Dr
- 1047 Ledgestone Dr
- 1072 Ledgestone Dr
- 1085 Ledgestone Dr
- 1074 Ledgestone Dr
- 1052 Ledgestone Dr
- 1076 Ledgestone Dr
- 1091 Ledgestone Dr
- 1041 Ledgestone Dr
- 1048 Ledgestone Dr
- 1078 Ledgestone Dr
- 425 Rockglen Dr
- 1101 Ledgestone Dr
- 1080 Ledgestone Dr