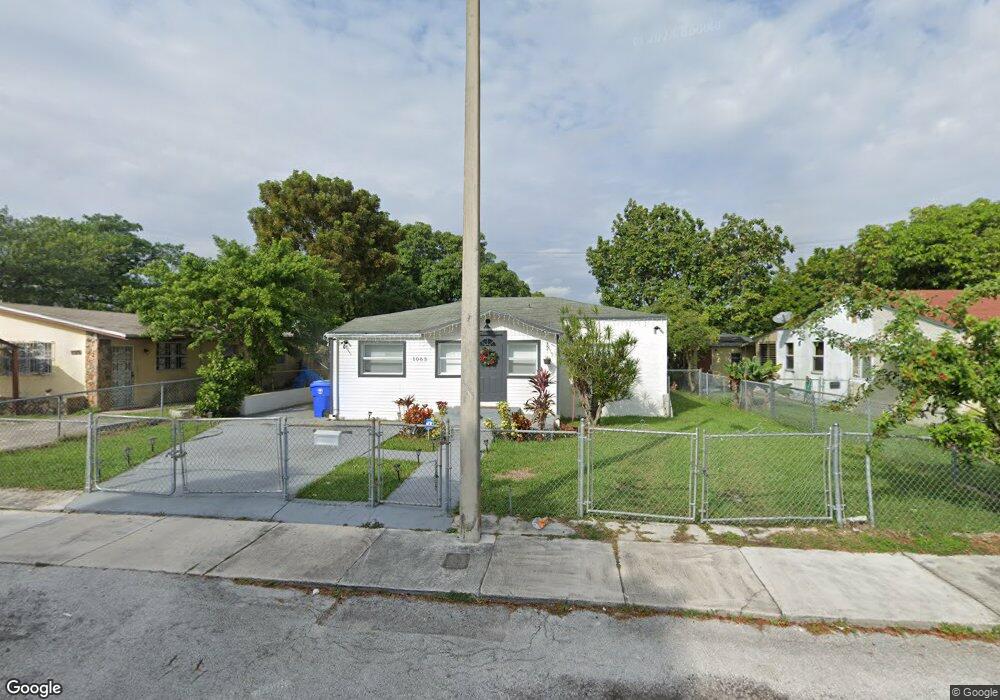
1065 NW 59th St Miami, FL 33127
Liberty City NeighborhoodEstimated Value: $255,000 - $401,000
2
Beds
1
Bath
960
Sq Ft
$362/Sq Ft
Est. Value
About This Home
This home is located at 1065 NW 59th St, Miami, FL 33127 and is currently estimated at $347,933, approximately $362 per square foot. 1065 NW 59th St is a home located in Miami-Dade County with nearby schools including Orchard Villa Elementary School, Brownsville Middle School, and Miami Northwestern Senior High School.
Ownership History
Date
Name
Owned For
Owner Type
Purchase Details
Closed on
Mar 6, 2020
Sold by
Jones Roslyn and Federal National Mortgage Asso
Bought by
Venture Cuatro Llc
Current Estimated Value
Purchase Details
Closed on
Jan 7, 2013
Sold by
Jones Roslyn
Bought by
Fannie Mae
Purchase Details
Closed on
Mar 28, 2006
Sold by
Jones Roslyn A
Bought by
Jones Roslyn and Hicks Antwan
Purchase Details
Closed on
May 23, 2005
Sold by
Sapp Joyce
Bought by
Jones Roslyn
Home Financials for this Owner
Home Financials are based on the most recent Mortgage that was taken out on this home.
Original Mortgage
$110,000
Interest Rate
5.51%
Mortgage Type
Fannie Mae Freddie Mac
Purchase Details
Closed on
Oct 25, 2004
Sold by
Hicks Antwan
Bought by
Sapp Joyce
Home Financials for this Owner
Home Financials are based on the most recent Mortgage that was taken out on this home.
Original Mortgage
$88,000
Interest Rate
7.9%
Mortgage Type
Unknown
Purchase Details
Closed on
Nov 19, 1999
Sold by
Banks Alfred
Bought by
Hicks Antwan
Create a Home Valuation Report for This Property
The Home Valuation Report is an in-depth analysis detailing your home's value as well as a comparison with similar homes in the area
Home Values in the Area
Average Home Value in this Area
Purchase History
| Date | Buyer | Sale Price | Title Company |
|---|---|---|---|
| Venture Cuatro Llc | $130,700 | None Available | |
| Fannie Mae | $1,600 | None Available | |
| Jones Roslyn | -- | None Available | |
| Jones Roslyn | $110,000 | Consolidated Title Co | |
| Sapp Joyce | $110,000 | Interactive Title | |
| Hicks Antwan | $71,500 | -- |
Source: Public Records
Mortgage History
| Date | Status | Borrower | Loan Amount |
|---|---|---|---|
| Previous Owner | Jones Roslyn | $110,000 | |
| Previous Owner | Sapp Joyce | $88,000 |
Source: Public Records
Tax History
| Year | Tax Paid | Tax Assessment Tax Assessment Total Assessment is a certain percentage of the fair market value that is determined by local assessors to be the total taxable value of land and additions on the property. | Land | Improvement |
|---|---|---|---|---|
| 2025 | $4,710 | $216,278 | -- | -- |
| 2024 | $4,530 | $196,617 | -- | -- |
| 2023 | $4,530 | $178,743 | $0 | $0 |
| 2022 | $3,956 | $162,494 | $0 | $0 |
| 2021 | $3,519 | $147,722 | $86,690 | $61,032 |
| 2020 | $2,102 | $123,324 | $62,292 | $61,032 |
| 2019 | $1,940 | $110,866 | $49,834 | $61,032 |
| 2018 | $1,668 | $87,465 | $35,818 | $51,647 |
| 2017 | $1,473 | $44,699 | $0 | $0 |
| 2016 | $1,334 | $40,636 | $0 | $0 |
| 2015 | $1,250 | $36,942 | $0 | $0 |
| 2014 | $1,172 | $33,584 | $0 | $0 |
Source: Public Records
Map
Nearby Homes
- 1126 NW 58th Terrace
- 929 NW 60th St
- 1121 NW 57th St
- 5842 NW 12th Ave
- 1222 NW 59th St
- 5621 NW 11th Ave
- 1130 NW 57th St
- 1121 NW 56th St
- 1051 NW 63rd St
- 790 NW 60th St
- 1243 NW 61st St
- 944 NW 64th St
- 1172 NW 64th St
- 1053 NW 55th Terrace
- 1264 NW 61st St
- 1035 NW 64th St
- 1286 NW 59th St
- 1284 NW 58th Terrace
- 1011 NW 64th St
- 1080 NW 65th St
- 1075 NW 59th St
- 1055 NW 59th St
- 1064 NW 60th St
- 1091 NW 1091 Nw 59 St
- 1045 NW 59th St
- 1074 NW 60th St
- 1054 NW 60th St
- 1084 NW 60th St
- 1066 NW 59th St
- 1044 NW 60th St
- 1056 NW 59th St
- 5901 NW 11th Ave
- 1035 NW 59th St
- 1086 NW 59th St
- 1046 NW 59th St
- 5911 NW 11th Ave
- 1034 NW 60th St
- 1096 NW 59th St
- 1036 NW 59th St
Your Personal Tour Guide
Ask me questions while you tour the home.