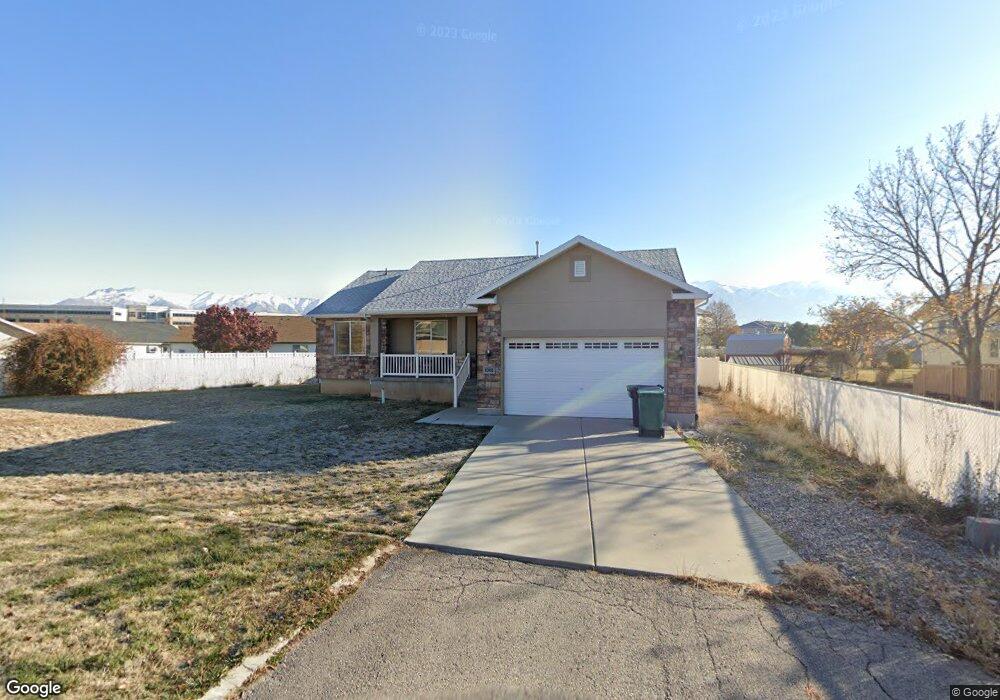
1065 S 1650 E Clearfield, UT 84015
Estimated Value: $500,000 - $609,000
3
Beds
2
Baths
2,898
Sq Ft
$187/Sq Ft
Est. Value
About This Home
This home is located at 1065 S 1650 E, Clearfield, UT 84015 and is currently estimated at $540,574, approximately $186 per square foot. 1065 S 1650 E is a home located in Davis County with nearby schools including South Clearfield Elementary School, North Davis Junior High School, and Northridge High School.
Ownership History
Date
Name
Owned For
Owner Type
Purchase Details
Closed on
Sep 20, 2018
Sold by
Ferrari Jonathan M and Ferrari Angela
Bought by
Hp Utah Llc
Current Estimated Value
Purchase Details
Closed on
Jul 12, 2013
Sold by
Moore Investment Properties Lc
Bought by
Moore Homes Lc
Purchase Details
Closed on
Jun 28, 2013
Sold by
Rindlesbach Ken W
Bought by
Moore Investment Properties Lc
Purchase Details
Closed on
Sep 6, 2011
Sold by
Briarwood Hollow Llc
Bought by
Rindlesbach Ken W and Ken W Rindlesbach Pension & Profit Shari
Purchase Details
Closed on
Nov 27, 2006
Sold by
Murri Construction Inc
Bought by
Briarwood Hollow Llc
Create a Home Valuation Report for This Property
The Home Valuation Report is an in-depth analysis detailing your home's value as well as a comparison with similar homes in the area
Home Values in the Area
Average Home Value in this Area
Purchase History
| Date | Buyer | Sale Price | Title Company |
|---|---|---|---|
| Hp Utah Llc | -- | Stewart Title Ins Agency | |
| Moore Homes Lc | -- | Guardian Title Ins Ag | |
| Moore Investment Properties Lc | -- | Guardian Title Ins Ag | |
| Rindlesbach Ken W | -- | Guardian Title Comp | |
| Briarwood Hollow Llc | -- | Bonneville Superior Title Co |
Source: Public Records
Tax History
| Year | Tax Paid | Tax Assessment Tax Assessment Total Assessment is a certain percentage of the fair market value that is determined by local assessors to be the total taxable value of land and additions on the property. | Land | Improvement |
|---|---|---|---|---|
| 2025 | $3,056 | $273,900 | $78,980 | $194,920 |
| 2024 | $2,931 | $264,549 | $75,365 | $189,184 |
| 2023 | $2,837 | $258,500 | $65,259 | $193,240 |
| 2022 | $3,081 | $502,000 | $120,378 | $381,622 |
| 2021 | $2,674 | $362,000 | $80,560 | $281,440 |
| 2020 | $2,387 | $321,000 | $69,816 | $251,184 |
| 2019 | $2,320 | $308,000 | $65,822 | $242,178 |
| 2018 | $2,134 | $276,000 | $55,502 | $220,498 |
| 2016 | $2,070 | $139,975 | $24,023 | $115,952 |
| 2015 | $1,860 | $119,900 | $24,023 | $95,877 |
| 2014 | $690 | $45,089 | $24,023 | $21,066 |
| 2013 | -- | $52,593 | $52,593 | $0 |
Source: Public Records
Map
Nearby Homes
- 1612 E 925 S
- 870 S 1625 E Unit A
- 865 S 1650 E Unit A
- 911 S 1500 E
- 1520 E 1100 S
- 1560 E 800 S Unit C
- 1543 E 750 S Unit C5
- 1644 E 700 S
- 2896 N 1175 W
- 2931 N 1175 W
- 1012 W 2525 N
- 2320 N 1085 W
- 2298 N 1085 W
- 1127 E 1050 S
- 820 W 2350 N
- 2386 N 800 W
- 1021 E 1225 S Unit A
- 876 S 1000 E
- 1648 W 1920 N
- 1888 W 1575 N Unit 235
Your Personal Tour Guide
Ask me questions while you tour the home.