10650 N 143rd St Waverly, NE 68462
Estimated Value: $164,000 - $292,000
4
Beds
1
Bath
1,136
Sq Ft
$193/Sq Ft
Est. Value
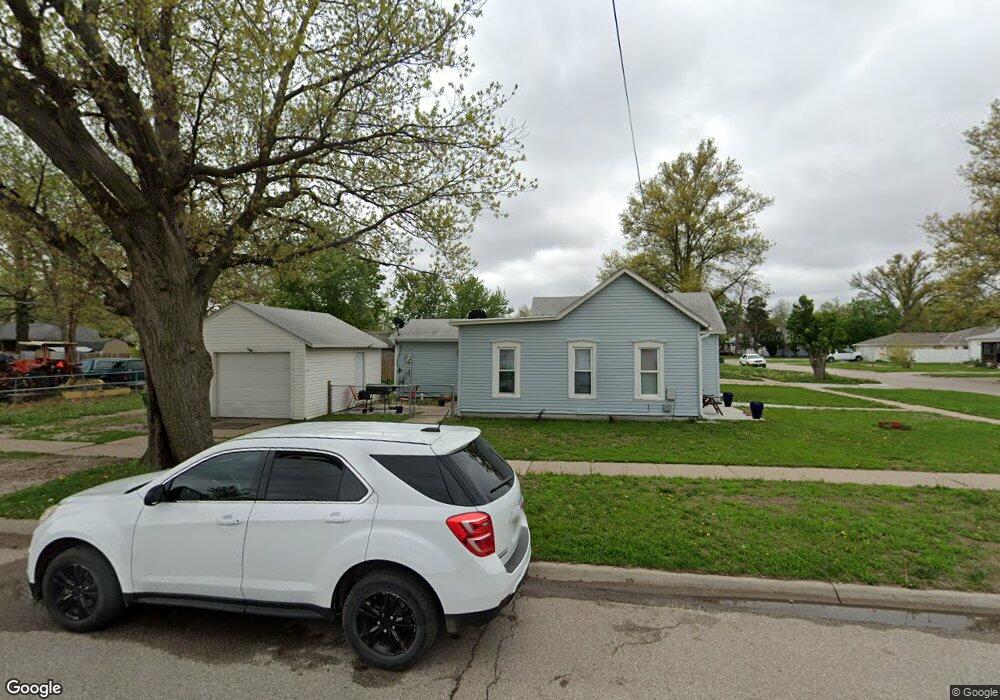
About This Home
This home is located at 10650 N 143rd St, Waverly, NE 68462 and is currently estimated at $219,066, approximately $192 per square foot. 10650 N 143rd St is a home located in Lancaster County with nearby schools including Waverly High School.
Ownership History
Date
Name
Owned For
Owner Type
Purchase Details
Closed on
Jul 18, 2019
Sold by
Hestermann John F
Bought by
Old Village Properties Llc
Current Estimated Value
Purchase Details
Closed on
Aug 29, 2003
Sold by
Cornells Llc
Bought by
Hestermann John F and Hestermann Wendy L
Home Financials for this Owner
Home Financials are based on the most recent Mortgage that was taken out on this home.
Original Mortgage
$65,800
Interest Rate
5.87%
Mortgage Type
Unknown
Purchase Details
Closed on
Feb 10, 2003
Sold by
Cornell Floyd and Cornell Kathleen A
Bought by
Cornells Llc
Purchase Details
Closed on
Feb 23, 2000
Sold by
Citibank Na
Bought by
Cornell Floyd and Cornell Kathleen A
Home Financials for this Owner
Home Financials are based on the most recent Mortgage that was taken out on this home.
Original Mortgage
$43,000
Interest Rate
8.19%
Purchase Details
Closed on
Dec 21, 1999
Sold by
Greene Lori Diane
Bought by
Financial Security Assurance Inc
Create a Home Valuation Report for This Property
The Home Valuation Report is an in-depth analysis detailing your home's value as well as a comparison with similar homes in the area
Home Values in the Area
Average Home Value in this Area
Purchase History
| Date | Buyer | Sale Price | Title Company |
|---|---|---|---|
| Old Village Properties Llc | -- | None Available | |
| Hestermann John F | $67,000 | -- | |
| Cornells Llc | -- | -- | |
| Cornell Floyd | $38,000 | -- | |
| Financial Security Assurance Inc | $34,000 | -- |
Source: Public Records
Mortgage History
| Date | Status | Borrower | Loan Amount |
|---|---|---|---|
| Previous Owner | Hestermann John F | $65,800 | |
| Previous Owner | Cornell Floyd | $43,000 |
Source: Public Records
Tax History Compared to Growth
Tax History
| Year | Tax Paid | Tax Assessment Tax Assessment Total Assessment is a certain percentage of the fair market value that is determined by local assessors to be the total taxable value of land and additions on the property. | Land | Improvement |
|---|---|---|---|---|
| 2025 | $1,474 | $123,300 | $70,000 | $53,300 |
| 2024 | $1,474 | $114,300 | $58,000 | $56,300 |
| 2023 | $1,755 | $107,800 | $58,000 | $49,800 |
| 2022 | $1,667 | $85,600 | $45,000 | $40,600 |
| 2021 | $1,574 | $85,600 | $45,000 | $40,600 |
| 2020 | $1,249 | $66,300 | $42,000 | $24,300 |
| 2019 | $1,250 | $66,300 | $42,000 | $24,300 |
| 2018 | $1,075 | $55,200 | $38,000 | $17,200 |
| 2017 | $1,079 | $55,200 | $38,000 | $17,200 |
| 2016 | $1,288 | $65,100 | $30,000 | $35,100 |
| 2015 | $1,280 | $65,100 | $30,000 | $35,100 |
| 2014 | $1,640 | $80,700 | $30,000 | $50,700 |
| 2013 | -- | $80,700 | $30,000 | $50,700 |
Source: Public Records
Map
Nearby Homes
- 14231 U S 6
- 14530 Jamestown St
- 15017 Jamestown St
- 15033 Jamestown St
- 15025 Jamestown St
- 13851 Lancashire St
- TBD Block 11 Lot 12
- TBD Block 8 Lot 1
- 10461 N 149th St
- 14540 Oak Ln
- TBD Block 10 Lot 29
- TBD Block 2 Lot 5
- 14540 Eastbourne St
- TBD Block 10 Lot 35
- TBD Block 10 Lot 34
- 10732 N 149th St
- 10724 N 149th St
- 14331 Quentin St
- TBD Block 6 Lot 9
- 13641 Kenilworth St
- 10640 N 143rd St
- 10630 N 143rd St
- 3 B4 N 143rd St
- 14351 Jamestown St
- 10620 N 143rd St
- 10641 N 144th St
- 10610 N 143rd St
- 10651 N 143rd St
- 10641 N 143rd St
- 10631 N 143rd St
- 10611 N 143rd St
- 14230 Ivanhoe St
- 10550 N 143rd St
- 14321 Ivanhoe St
- 1 B9 L7 Evandale Estates
- 14421 Jamestown St
- 14351 Ivanhoe St
- 10540 N 143rd St
- 14420 Jamestown St
- 14231 Highway 6